

Alphabet Inc. ($GOOG) Stock: Hits Record Highs as Analysts Boost Targets
TLDR
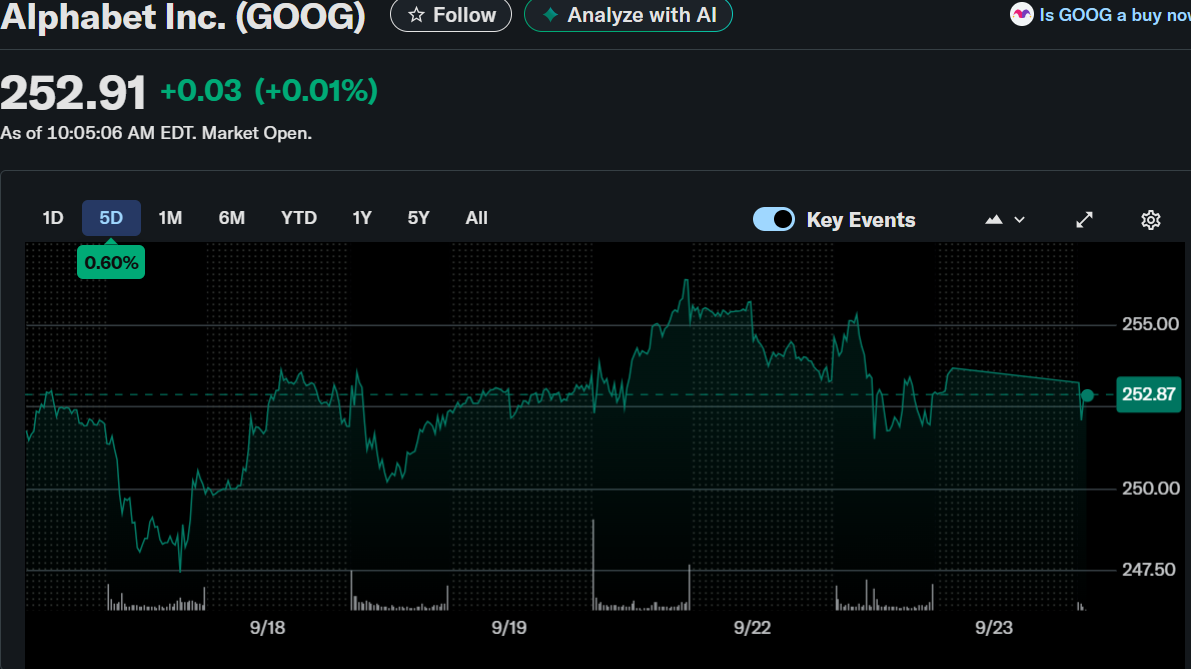
- Alphabet (GOOG) closed at $252.88 on September 22, 2025, with pre-market at $253.53.
- Stock hit $242.13 earlier this month, lifting its market cap to $2.92 trillion.
- DOJ ruling eased regulatory pressure, with analysts lifting price targets to $285.
- Google Cloud, ads, and AI remain major growth drivers, fueling revenue and margins.
- Shares delivered a 54% one-year return, far outpacing the S&P 500’s 17.38%.
Alphabet Inc. (NASDAQ: GOOG) closed at $252.88 on September 22, 2025, down 0.92% during the session, with pre-market trading at $253.53.
Alphabet Inc. (GOOG)
The stock recently reached an all-time high of $242.13 on September 11, lifting its market capitalization to $2.92 trillion. As of Sep 19th, a new all-time high was reached $256.70, and with the Sep 22nd day range of $250.81 to $256.31, edging a little closer to the all-time high. The momentum highlights Alphabet’s dominance across advertising, cloud, and AI markets.
Analyst Upgrades and DOJ Ruling
On September 22, Truist reaffirmed its “Buy” rating, raising the price target to $285 per share from $225. Piper Sandler also boosted its target to $285 from $220, maintaining an “Overweight” rating. Analysts cited the recent Department of Justice ruling, which requires Google to share data with competitors but avoids structural remedies that could disrupt its core business. This clarity helped ease market concerns about long-term regulatory risks.
AI and Search Market Strength
Alphabet continues to dominate search, holding over 90% market share despite the rise of generative AI platforms. Analysts noted AI-based searches account for only about 1% of referral traffic and minimal conversions, limiting their immediate impact on Google’s ad revenues. Instead, AI chatbots are expanding total search market opportunities. New ad products, including AI Max for Search Campaigns, are expected to drive growth in 2026.
Financial Performance and Valuation
Alphabet posted strong profitability with a 31.12% profit margin, 34.83% return on equity, and $115.57 billion in net income over the trailing twelve months. Its trailing P/E stands at 26.96, with a forward P/E of 23.98, signaling sustained earnings potential. The company maintains a solid balance sheet with $95.15 billion in cash and a conservative debt-to-equity ratio of 11.48%. Levered free cash flow reached nearly $50 billion.
Returns Outpacing the Market
Alphabet stock continues to outperform the broader market. Its one-year return of 54.27% nearly triples the S&P 500’s 17.38%. Over five years, Alphabet delivered a 247.48% return compared with the S&P 500’s 101.89%. The stock’s valuation reflects investor confidence in long-term AI-driven growth.
Conclusion
Alphabet’s record highs, supported by strong fundamentals, analyst upgrades, and regulatory clarity, reinforce its position as a top-tier growth stock. With robust AI integration and dominance in digital ads, Alphabet remains well-positioned to extend its market leadership.
The post Alphabet Inc. ($GOOG) Stock: Hits Record Highs as Analysts Boost Targets appeared first on CoinCentral.
You May Also Like

When A Scam Sounds Too Real: Victim Ignores Cops And Loses Thousands At Crypto ATM

Canada Canadian Portfolio Investment in Foreign Securities rose from previous $9.04B to $17.41B in July

