Analyst Points To $82,000 As Most Crucial Bitcoin Price Level — Here’s Why
In a not-so-surprising turn of events, the bearish orientation of the Bitcoin price has continued into the month of December, suggesting that the premier cryptocurrency could end the year in the red. Interestingly, recent on-chain data has offered insights into the likely direction of Bitcoin based on the integrity of an important price level.
Active Market Participants’ Cost Basis At $82,000
In a December 5 post on the X platform, market analyst Burak Kesmeci shared an interesting outlook on the direction of the Bitcoin price.
The analyst disclosed that whatever happens around the $82,000 mark could make or mar Bitcoin’s trajectory in the near term. To demonstrate why this price region is so important, Kesmeci pointed out that it appears to be the convergence point of two highly influential cost bases in Bitcoin’s history.
Kesmeci revealed that the Bitcoin spot exchange-traded funds have an average purchase cost of approximately $82,000. Because ETFs are one of Bitcoin’s strongest demand sources, tracking the values of their average cost-basis could serve as a good means to tell where the market stands institutionally.
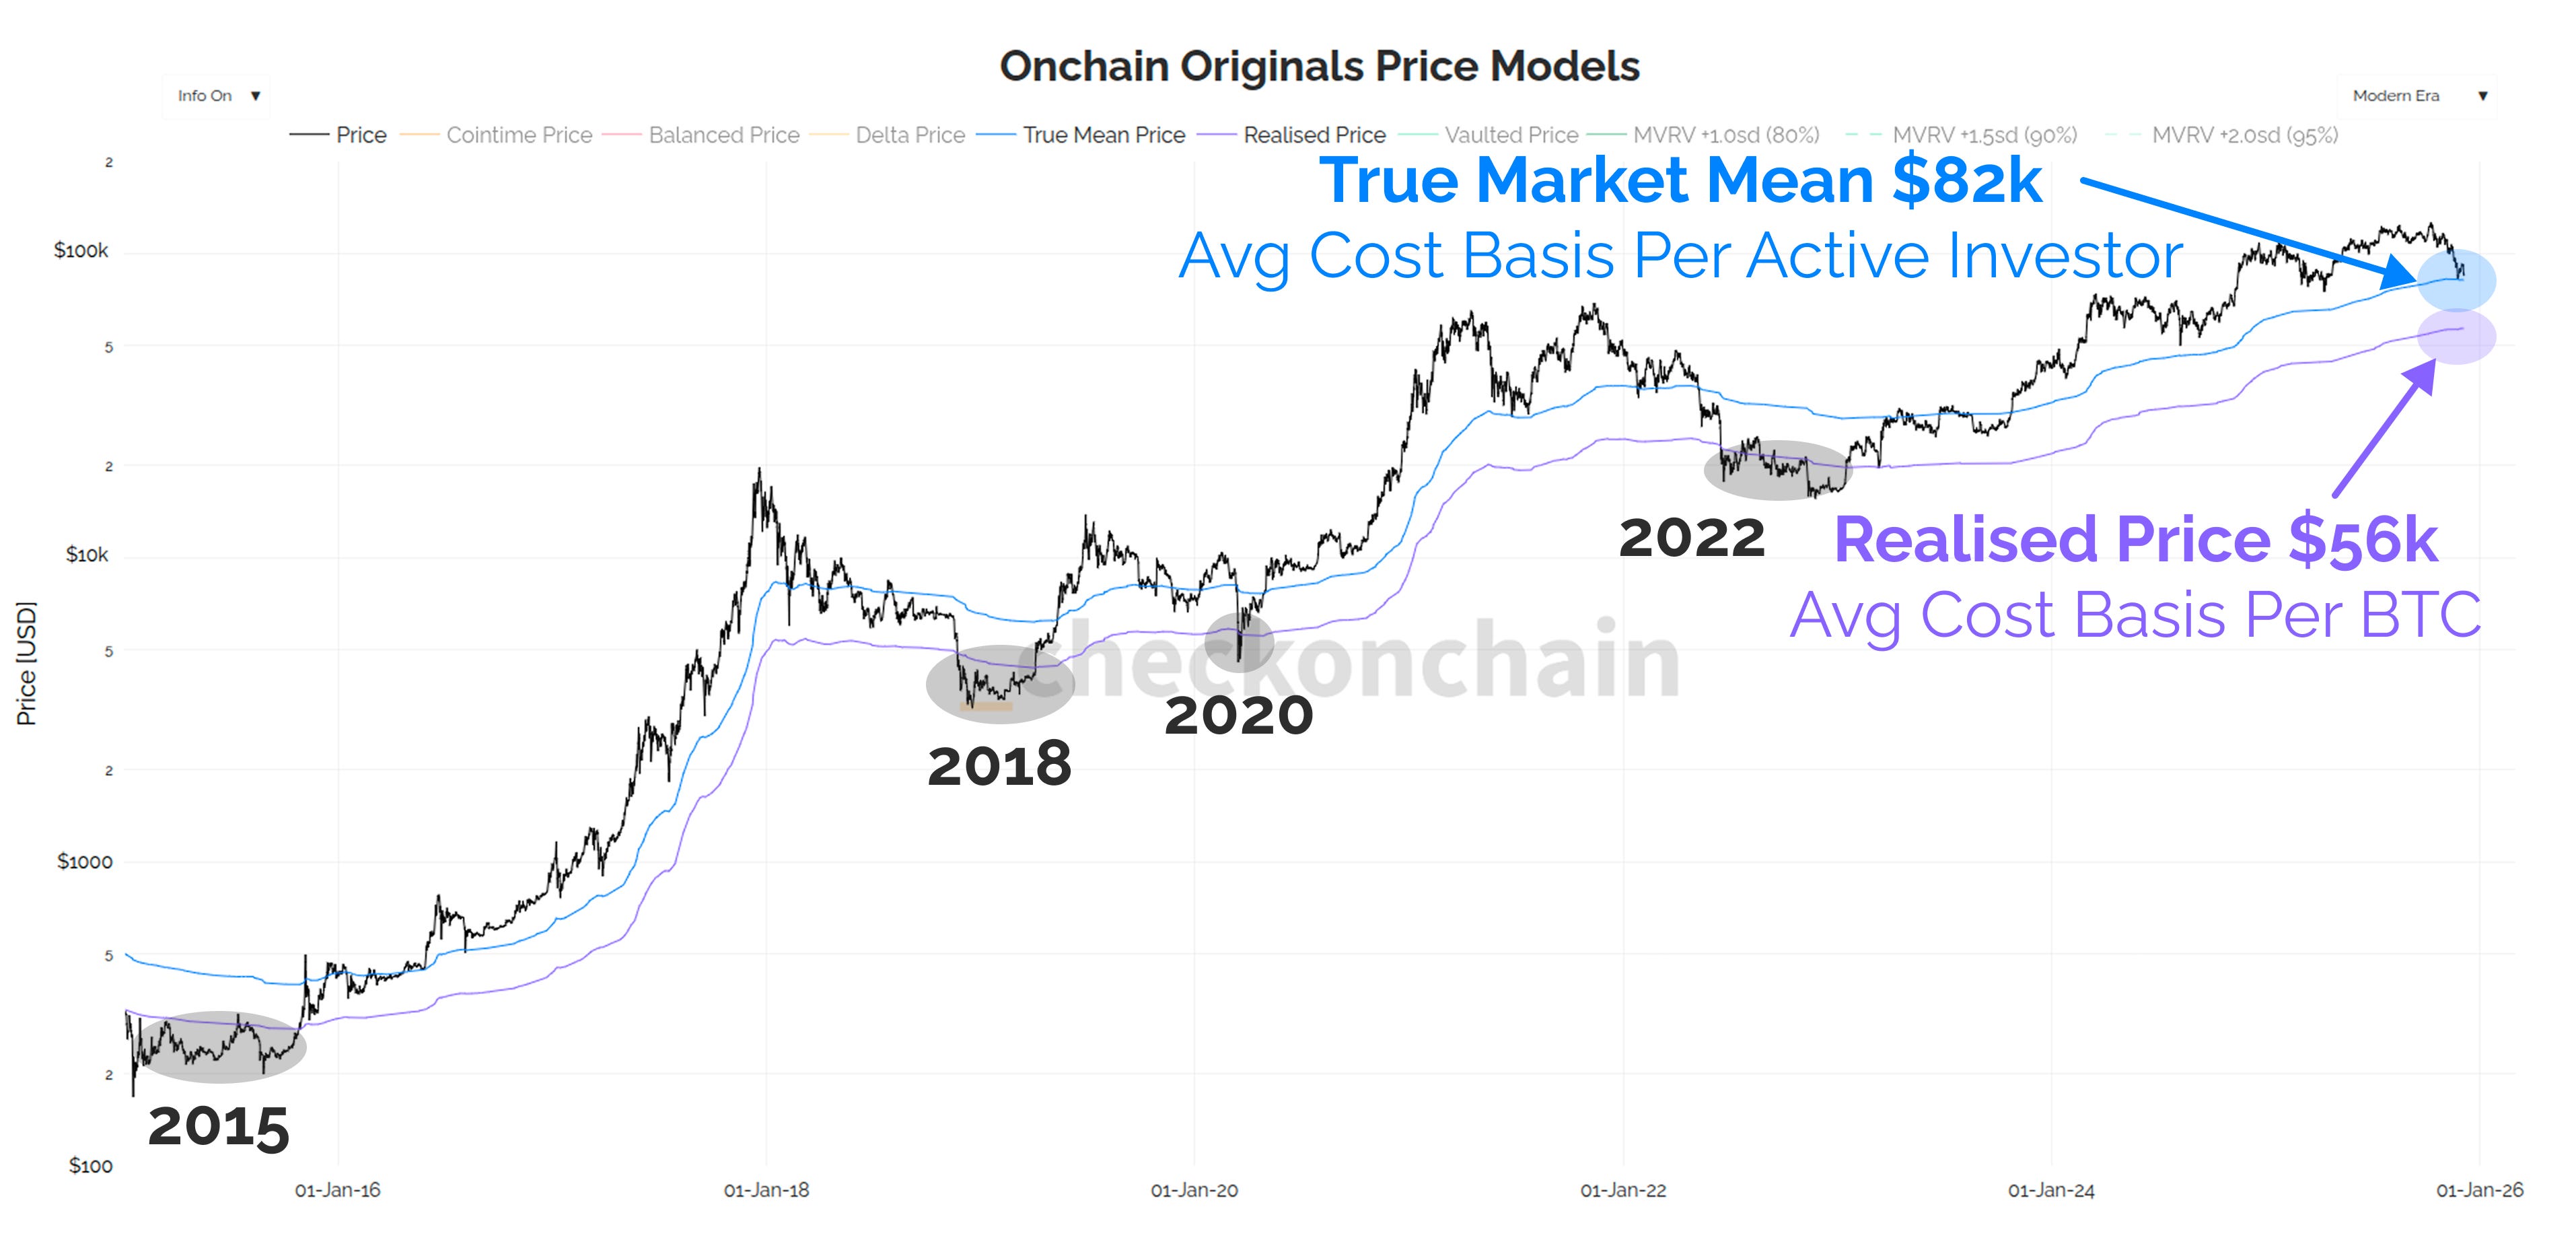
The crypto pundit also referenced the Bitcoin True Market Mean metric, which monitors the cost at which active investors procured their holdings—except for mined or rarely-moved BTC. Notably, in the current market cycle, Bitcoin’s active participants mostly purchased their coins around a valuation of $82,000.
What Happens If $82,000 Fails?
Usually, when price slips beneath any major price support, there is, in turn, an increase in overall selling pressure, as buy-side liquidity is converted to bearish momentum via losses incurred by investors. Hence, in the scenario where $82,000 fails to hold, a wave of bearish pressure is expected to ensue, as Bitcoin’s active investors try to cut their losses.
However, Kesmeci expects something even more specific to follow. According to historical data, whenever Bitcoin falls beneath its active market participant cost basis, it often falls further downwards, as though it is targeting its Realized Price.
At the moment, the Bitcoin Realized Price sits near $56,000 — a price level significantly beneath its investors’ average cost basis. Kesmeci therefore warned that a slip beneath $82,000 could precede Bitcoin’s sharp downturn towards $56,000.
This would represent an almost 40% decline from the current price point. As of this writing, the price of BTC stands at around $89,310, reflecting an over 3% dip in the past 24 hours.
You May Also Like

Tether CEO Delivers Rare Bitcoin Price Comment
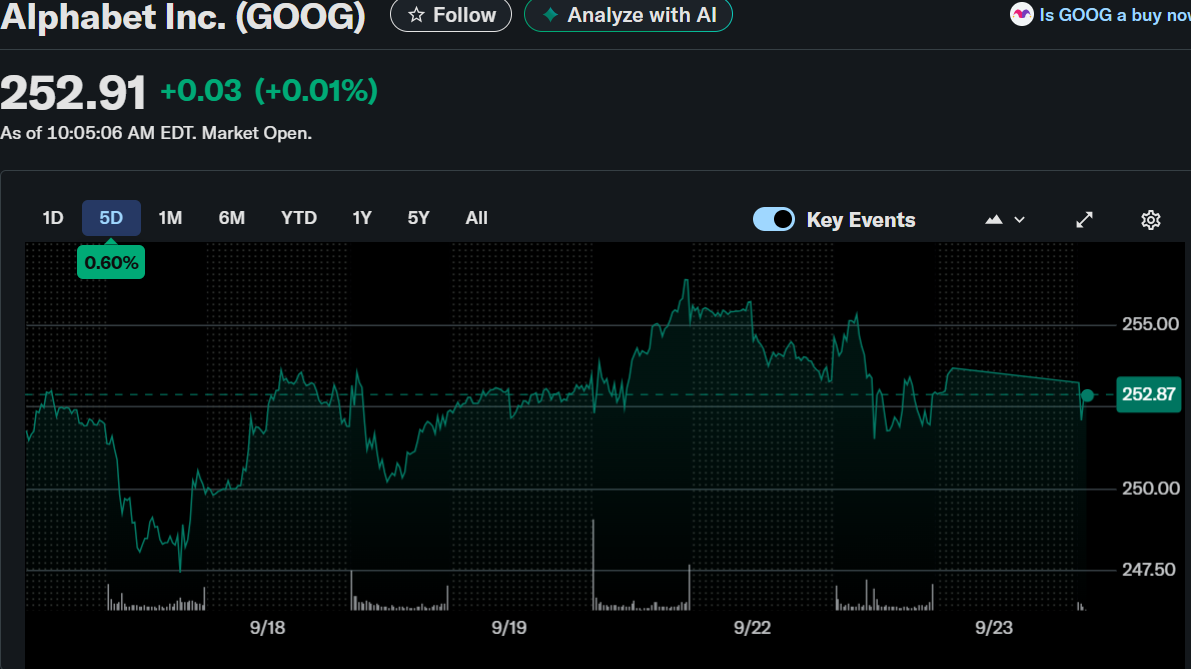
Alphabet Inc. ($GOOG) Stock: Hits Record Highs as Analysts Boost Targets