

Alphabet Stock tests $358 support as bearish pressure builds

Alphabet stock trades near $363, showing relative weakness by closing lower on June 8 despite broader market gains. The daily chart reveals GOOGL caught between its daily support and persistent bearish pressure, signaling caution ahead.
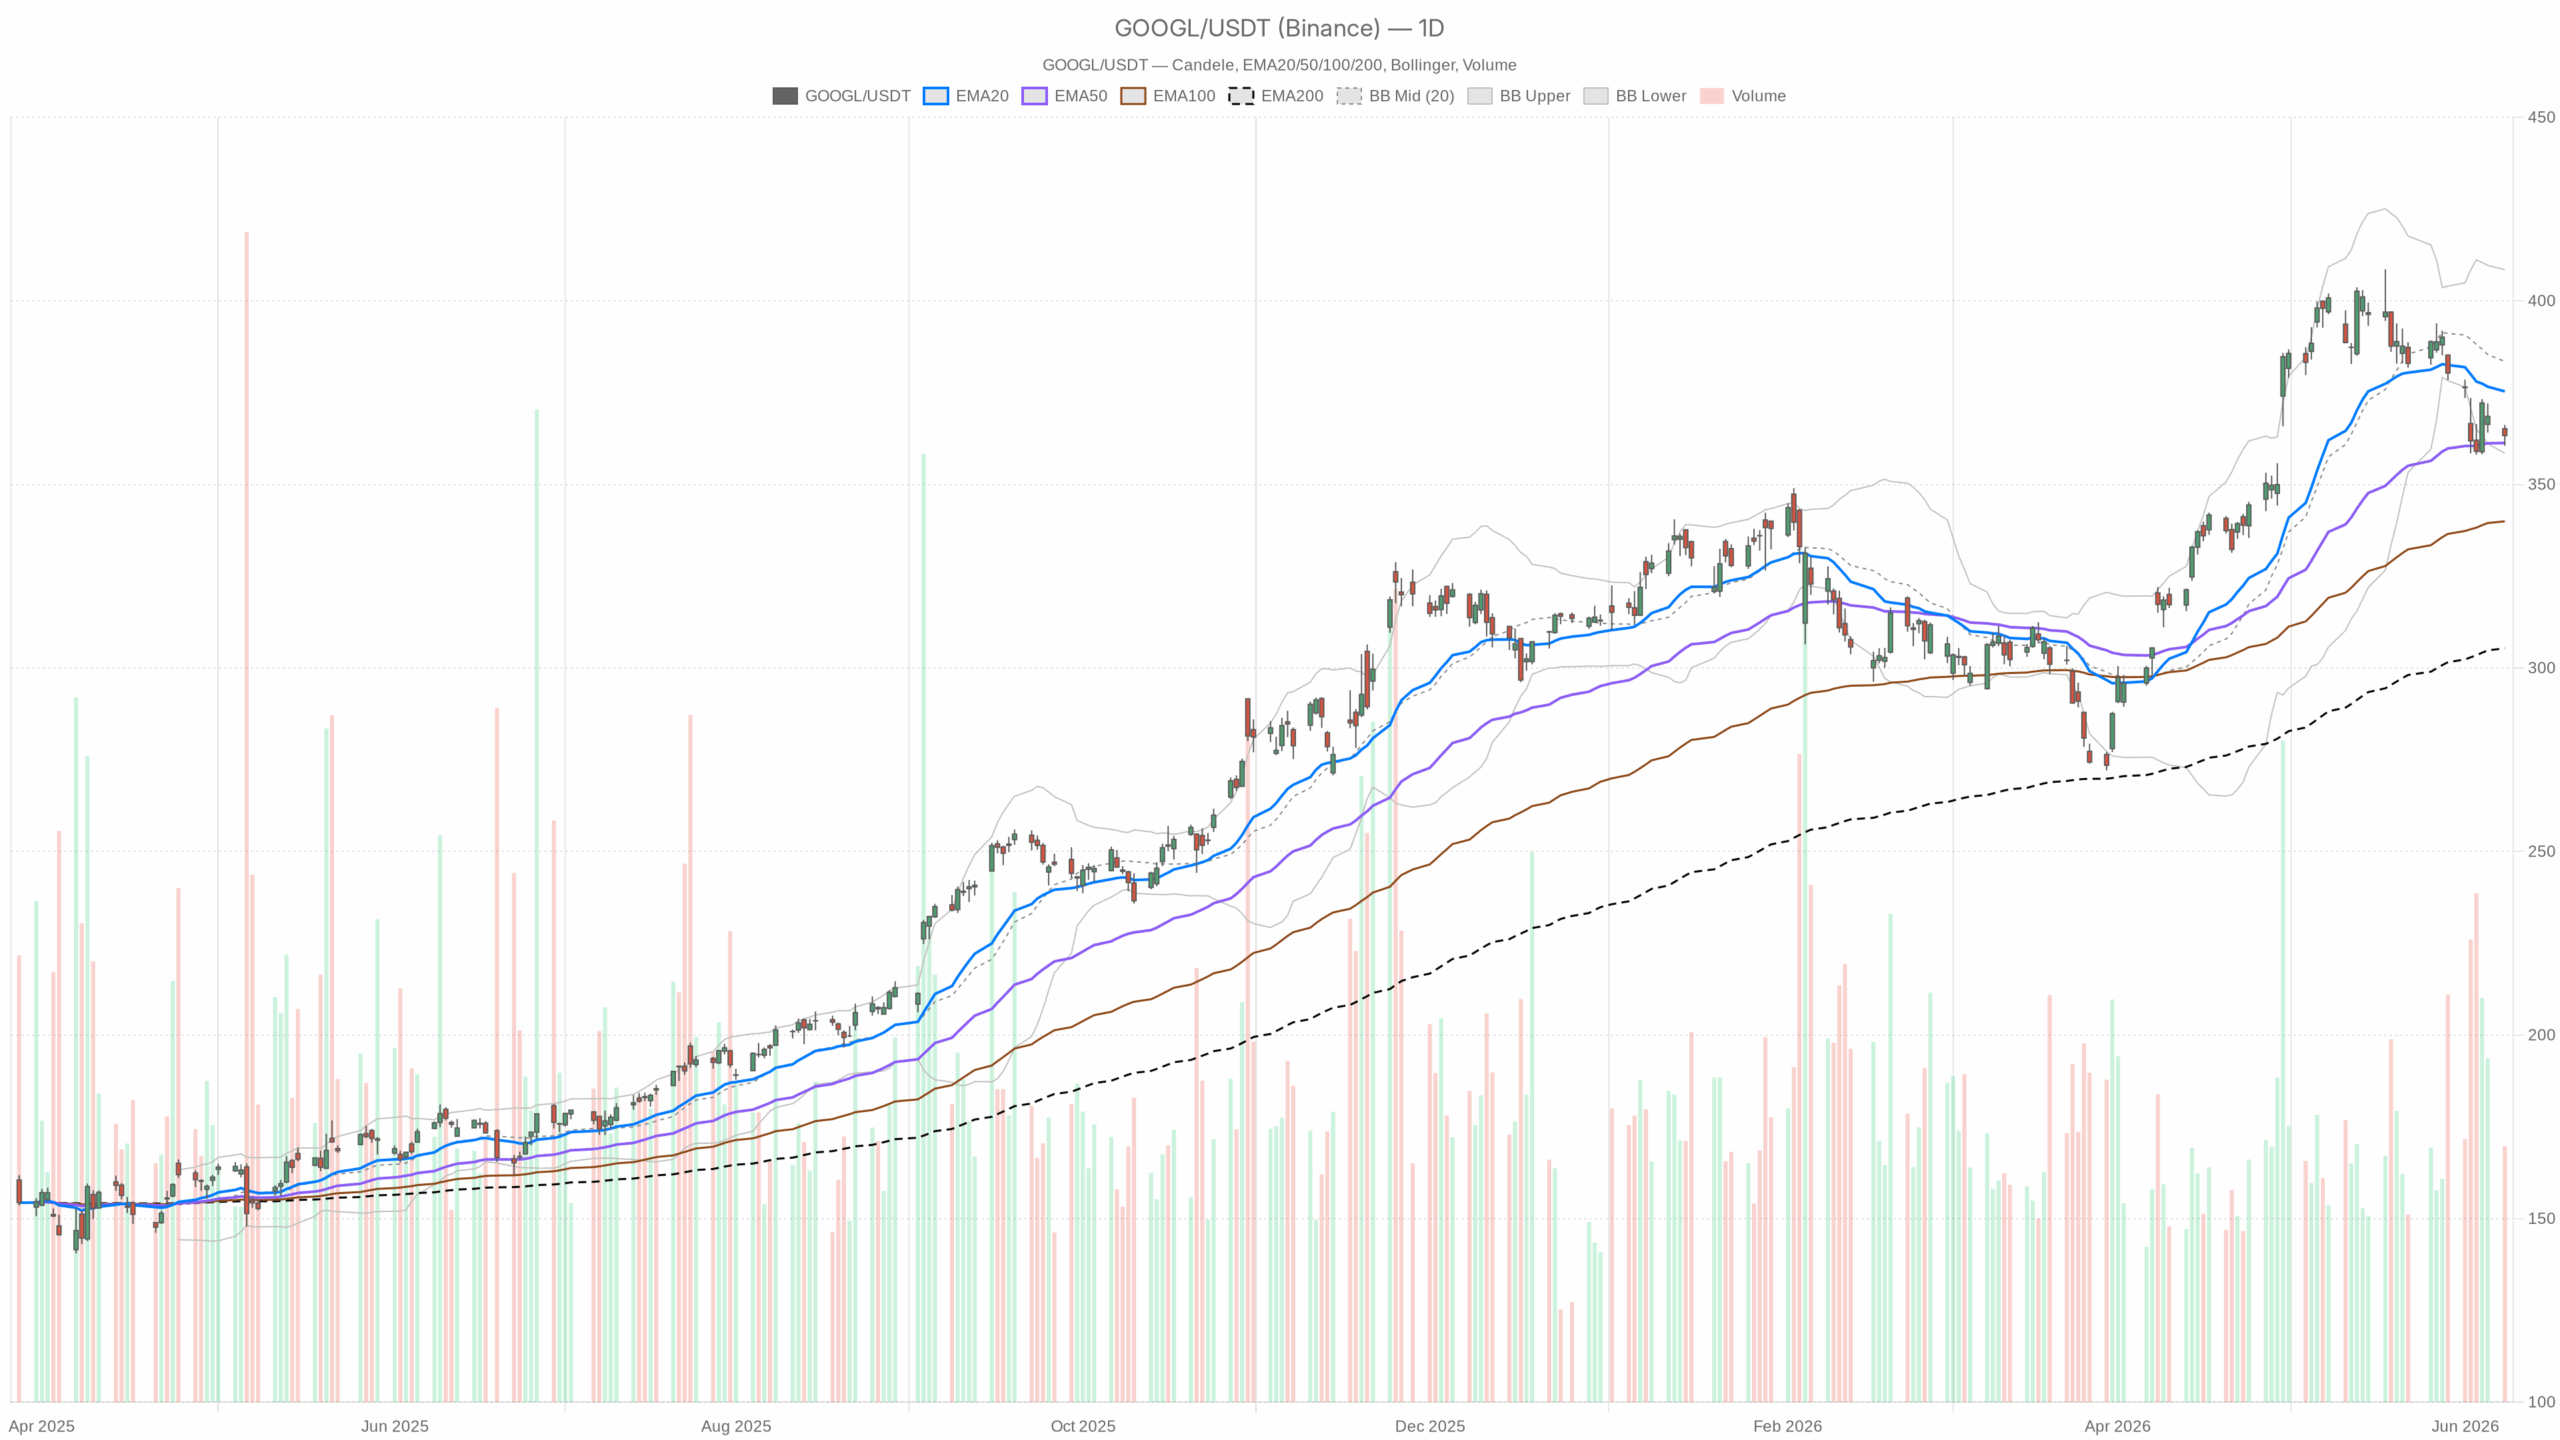 GOOGL — daily chart with candlesticks, EMA20/EMA50 and volume.
Daily Chart Overview: Alphabet Stock Faces Neutral-to-Bearish Bias
The daily timeframe displays a neutral-to-bearish setup. GOOGL sits just above the lower Bollinger Band and below a declining EMA20, underscoring downward momentum. Immediate support comes from the EMA50 at $361.29, forming a structural floor near the current price. Meanwhile, the long-term uptrend remains intact, supported by the EMA200 at $305.37, which still anchors broader bullish sentiment. However, the EMA20 at $375.35 remains well above, reflecting meaningful pullback momentum.
Momentum indicators align with this view. The daily RSI at 43.37 indicates weakening momentum without oversold pressure. The MACD histogram registers -5.03, with the signal line vastly above the MACD line, a sign of sustained selling pressure over multiple sessions.
Key Support and Resistance Levels on the Daily Chart
Bollinger Bands set the lower boundary at $358.49, creating a significant confluence zone between $358 and $361, matching the EMA50 support. A breakdown below this area could trigger a sharper decline. Conversely, the midline resistance at $383.50 represents the first recovery target but remains distant given current weakness.
Volatility remains a crucial factor: the daily ATR at $9.69 highlights GOOGL’s price swings, emphasizing the need for caution during this high-volatility phase.
Hourly Chart Confirms Bearish Momentum for Alphabet Stock
The intraday structure clearly favors the bears. EMAs are stacked bearish on the 1-hour chart, with EMA20 at $366.06 below EMA50 at $370.70, which sits below EMA200 at $373.55. GOOGL trades beneath all three moving averages near $363.33, reflecting sustained intraday selling pressure. This positioning pushes price deeply into the lower half of the 1H Bollinger Bands.
The 1-hour MACD histogram is negative at -0.18. Although the MACD line is close to crossing the signal line, no bullish confirmation has emerged. Similarly, the 1-hour RSI at 41.79 is weak, echoing the daily reading and indicating that dip buyers have yet to step in aggressively.
Short-Term Signals and 15-Minute Chart Indications
A subtle shift appears on the 15-minute chart, where the MACD histogram flipped to +0.17, suggesting very short-term buying momentum near the $363 area. This does not signal a reversal but rather a pause in bearish pressure.
Price remains below its EMA50 and EMA200 on this timeframe. The 15-minute pivot support at $362.72 has recently held, while the ATR of $1.28 indicates tight range conditions, implying that a decisive move could quickly develop if either pivot breaks.
Fundamental Context and Market Sentiment Around Alphabet Stock
GOOGL’s decline amid a broadly positive market adds to technical concerns. This underperformance may reflect institutional repositioning or a wider rotation away from large-cap tech stocks.
On the other hand, recent constructive developments include the IBM partnership with Google Cloud AI announced on June 4, highlighting continued enterprise AI monetization. This partnership may provide a longer-term fundamental catalyst.
Additionally, Jim Cramer’s comments on stock buybacks suggest potential for capital deployment that could support Alphabet shares over time.
Potential Scenarios for Alphabet Stock
Bullish Scenario
For a bullish shift, GOOGL must hold the $358–$361 support zone decisively. Stabilization here, followed by reclaiming the EMA50 on the daily chart, would mark the first sign of recovery. Surpassing $375 to flip the EMA20 from resistance to support would further confirm a short-term trend reversal. Continued enterprise AI deal traction and a broader market risk-on environment could reinforce this case.
Bearish Scenario
The bearish outlook crystallizes if GOOGL closes decisively below $358 on the daily chart. Such a break would penetrate both the lower Bollinger Band and EMA50, representing structural breakdown. A sustained decline would likely accelerate the negative MACD histogram and push price significantly lower, consistent with the current bearish momentum profile.
Conclusion: Alphabet Stock Remains Technically Fragile
Alphabet stock occupies a technically vulnerable position without breaking its long-term uptrend, thanks to the EMA200. However, intermediate-term pressure and high volatility keep the $358–$361 support range critical. Until buyers show conviction here, the path of least resistance remains downward.


Ayrıca Şunları da Beğenebilirsiniz

Is retail coming back to crypto? What the search data says

Drift Protocol Breach Triggers Up to $285 Million Losses

Phemex Publishes April 2026 Proof of Reserves, Reporting 131% Total Reserve Ratio


Popüler Haberler
Daha fazla
