
What are Fibonacci Retracements?
Fibonacci Sequence
The Meaning and Purpose of Fibonacci Retracements
How to Use Fibonacci Retracements
热门文章
谷歌(GOOGL)股息分析,值得持有吗?
多年来,Alphabet Inc.(谷歌)以其将每一分钱的利润重新投资回业务而闻名,没有向股东支付股息。最近,这家科技巨头终于启动了现金股息计划。这导致许多投资者搜索“GOOGL股息”,以查看该股票现在是否是一个可行的收入生成器。虽然引入股息是财务成熟的标志,但对于散户投资者来说,现实情况却大不相同。与传统收入股票或高收益储蓄账户相比,股息收益率仍然相对较低。对于2026年寻求显著资本增长的交易者

GOOG与GOOGL:有什么区别?(你应该交易哪一个?)
当初学者第一次查找Alphabet(谷歌)股票时,他们常常会对看到两个不同的股票代码感到困惑:GOOG和GOOGL。两者都代表同一家公司,但它们在不同的代码下交易。如果你想知道“GOOG和GOOGL之间有什么区别”,以及哪一个更适合交易,你来对地方了。虽然这种区别对于公司治理很重要,但对于希望从价格波动中获利的普通交易者来说,解决方案要简单得多——尤其是在MEXC上提供GOOGL合约的情况下。核心

账号相关常见问题汇总
1. 账号登录问题1.1 手机号、邮箱均无法使用时,如何登录账号如果记得账号登录密码:Web:在官网注册登录页面,输入账号和密码后,点击首页右上角【人像图标】-【安全中心】- 手机/邮箱验证右侧的【修改】-【安全项丢失】,按照页面的提示进行操作。App:进入登录页面,输入账号和密码后点击首页左上角【人像图标】-【安全中心】-【绑定手机/绑定邮箱】-【安全项丢失】,按照页面的提示进行操作。如果忘记账
AMD股价2030年预测:人工智能会将其推向新高吗?
随着人工智能革命重塑全球经济,投资者们正在寻找下一个大赢家。尽管英伟达(NVDA)目前处于领先地位,但AMD(Advanced Micro Devices)正逐渐成为最强有力的竞争者。这引发了人们对AMD 2030年股价预测的极大兴趣。 许多分析师认为,到2030年,半导体市场将显著扩张,可能会将AMD股价推高至400美元甚至500美元以上。然而,对于精明的市场参与者来说,等待四年才能实现这些收益
热门加密动态
查看更多
ASTER Stop Loss Mastery: 锁定利润
了解止损和止盈在 ASTER 交易中的重要性 风险管理至关重要,特别是在波动性较大的 ASTER 市场中,由于价格经常出现显著波动。 适当的止损和止盈订单 是保护资本和确保利润的关键工具,尤其是在每日 ASTER 波动率可能达到 5-20% 的市场中。 预先设定的退出策略 有助于 ASTER 交易者避免情绪化决策,减少恐惧和贪婪这两种心理因素的影响——它们常常导致交易者持有亏损头寸过久或过早平仓盈

XR1 Stop Loss Mastery: Lock in Profits
了解在XR1交易中止损和止盈的重要性 由于频繁的价格波动和不可预测的市场事件,风险管理在波动的XR1市场中至关重要。 适当的止损和止盈订单通过自动设置退出点来保护资本并确保利润,减少突发市场反转的影响。 预先确定的退出策略的心理益处包括最小化情绪化决策,这些决策通常受到恐惧和贪婪的影响。 交易者常犯的错误包括止损设置得太紧、将止损放在显而易见的水平上,以及未能根据市场条件的变化调整水平。 在高度波

RXS Stop Loss Mastery: Lock in Profits
了解止损和止盈在RXS交易中的重要性 风险管理在波动的RXS市场中至关重要,因为价格波动频繁且事件难以预测。 适当的止损和止盈订单通过自动设置退出点来保护资本并锁定利润,减少突发市场波动的影响。 预先确定的退出策略的心理好处包括减少情绪化决策,这些决策通常受到恐惧和贪婪的影响。 交易者常犯的错误包括止损设置得太紧(导致过早退出)、将止损放在明显水平(大玩家可能触发它们)以及未能随着市场条件的变化调

Sui 隐私升级引爆 Meme 币热潮:BEEG 如何借势成为 2026 年百倍潜力币
深度解析 Sui Privacy Summer 如何推动 BEEG 价格潜力。了解为什么 BEEG 可能成为 2026 年下一个 100 倍 Sui 链 Meme 币,以及为何在 MEXC 交易 BEEG 是最佳选择。 Key Takeaways Sui 2026 隐私升级将为生态系统带来协议级隐私功能,BEEG 作为 Sui 链头部 Meme 币将率先受益 技术优势加持:Sui 的低延迟(亚秒级
热门新闻
查看更多
Sui (SUI) 显示复苏迹象,在收复关键支撑位后价格瞄准 $2.35
Sui (SUI) 似乎正在企稳,因为尽管近期出现亏损,它仍成功守住了一个重要的支撑位。该代币目前正面临阻力

当铺连锁店计划在俄罗斯发放加密货币抵押贷款
俄罗斯一家典当行连锁店可能很快将开始提供以加密货币作为抵押的贷款服务,并计划未来接受其他数字资产。该公告

比特币短期持有者接近盈利翻转:关键水平成为焦点
Bitcoin已在更稳固的基础上开启新年,从2025年末的疲软中复苏,并向92,000美元水平回升。价格走势已有所改善,而短

TRX 2026年1月12日:上升趋势中的关键阻力位测试
该帖文《TRX 2026年1月12日:上升趋势中的关键阻力位测试》发表于 BitcoinEthereumNews.com。TRON (TRX) 已进入关键阻力位测试阶段
相关文章
搞懂 MEXC 合约资金费率,从此不再为“隐形成本”买单!
你是不是也遇到过这样的情况:合约交易看对了方向,收益却越来越少?账户余额莫名其妙减少?其实你可能忽略了一个关键细节——资金费率。在 MEXC 永续合约交易中,资金费率是很多新手忽视却极为重要的成本变量。今天我们就来一文讲透它的本质、计算方式、结算规则以及如何避坑,让你从此看清“隐形成本”的真相。1.什么是资金费率?新手必须搞懂的“费用桥梁”资金费率(Funding Rate)是一种用于调节合约市场
如何在MEXC上使用TradingView
TradingView 是一个交易分析的工具网站,功能强大,能够适用于不同经验水平的交易用户。MEXC 已经集成 TradingView 图表工具,您可以在 MEXC 平台直接使用 TradingView 。如何在 MEXC 上使用 TradingView我们以现货交易页面为例,进行 TradingView 图表相关功能的演示。合约交易页面设置方式和现货交易页面完全一样。1. 蜡烛图的设置蜡烛图即
加密市场常用技术指标全解析,助你精准把握市场脉搏
在加密货币交易中,技术指标分析是依据一定的数理统计方法,运用一些复杂的计算公式,来判断行情走势的量化的分析方法,能够为投资者提供直观的趋势参考。MEXC 平台提供了众多的技术分析指标,其中包括移动平均线(MA)、指数移动平均线(EMA)、指数平滑移动平均线(MACD)、布林线(BOLL)以及相对强弱指数(RSI)等经典指标。*BTN-点击开始合约之旅&BTNURL=https://www.
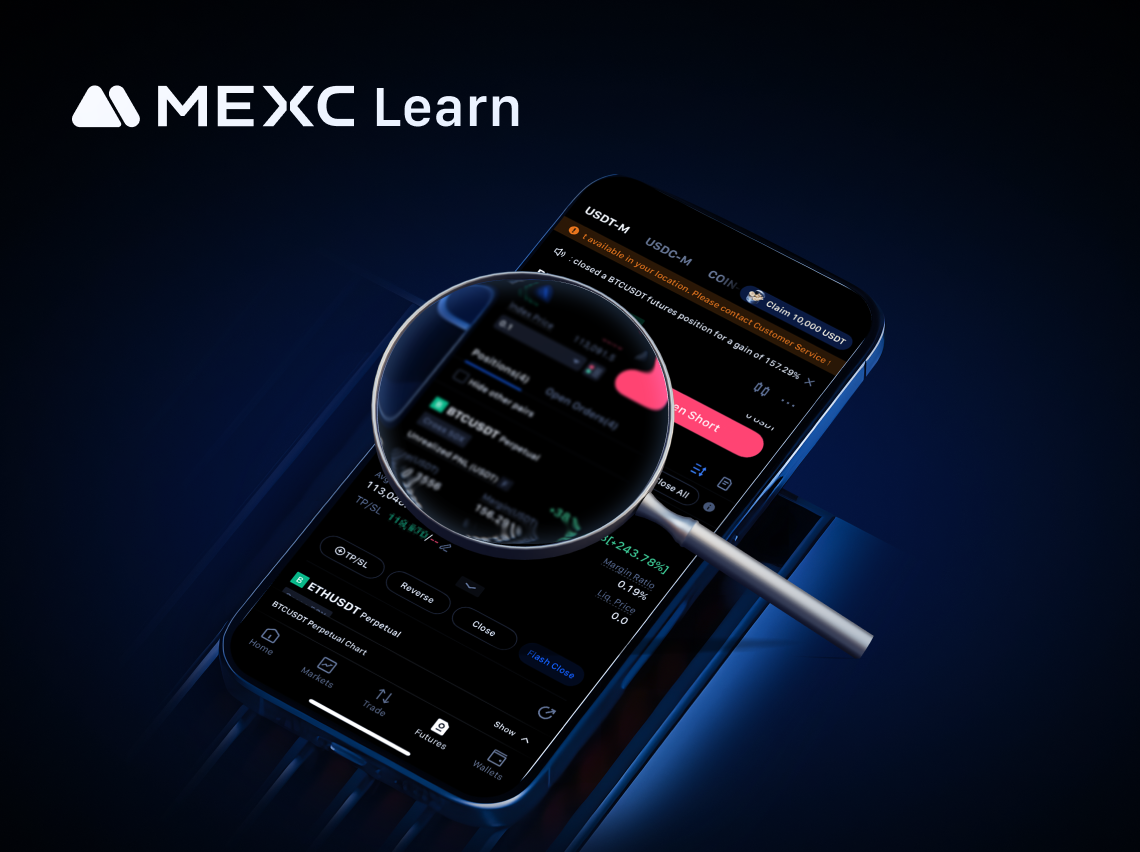
随时查看MEXC合约账户资金和持仓情况,对自己的合约交易了如指掌
加密货币合约交易凭借灵活的交易方式和丰富的交易品种,备受投资者青睐。特别是MEXC合约凭借超过1300个合约交易对和超低的交易费率(maker最低0费率,taker最低0.02%)广受用户好评。不过需要注意的是,合约交易是具有一定风险的交易行为,所以在MEXC交易所进行合约交易时,要建立成熟的风险管理机制,及时掌握账户资金和持仓情况是提升交易效率和控制风险的重要方法之一。1. 从MEXC App端
