
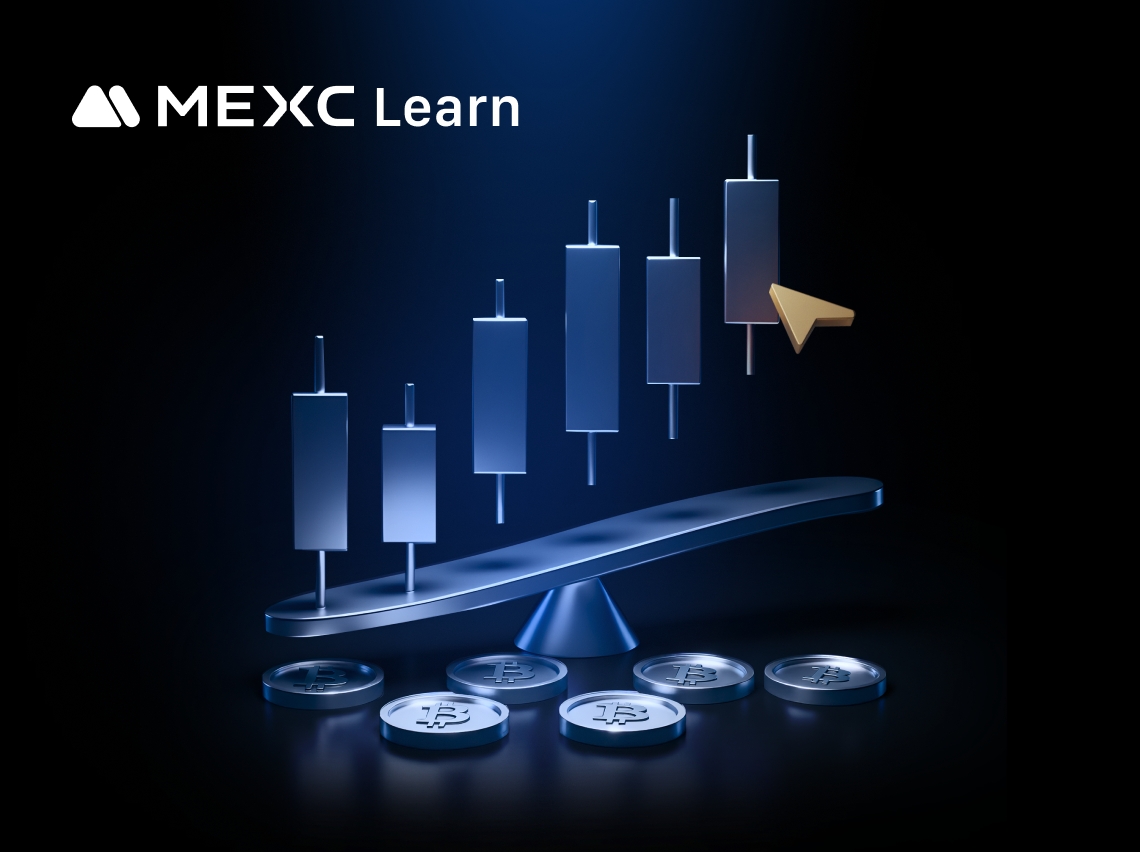
How to Use Drawing Tools (Original K-Line)
Website
App

জনপ্রিয় আর্টিকেল

How to Buy Bitcoin? A Complete Beginner's Guide
Buying Bitcoin has become surprisingly straightforward in recent years, but many beginners still feel overwhelmed by the process.This guide walks you through exactly how to buy Bitcoin on MEXC, one of

Who Is Buying Up BTC? Major Bitcoin Holders Revealed
Bitcoin's price recently surged past $95,000 following major institutional purchases, signaling a new wave of accumulation.Over $164 billion in BTC is now held by public entities, with corporations, g

How to Buy Bitcoin Safely? Step-by-Step Guide for Beginners
Buying Bitcoin can feel overwhelming when you're worried about hackers, scams, and losing your investment. This guide walks you through exactly how to buy Bitcoin safely, from choosing a secure platfo
Why Is Gold Reaching a Record High? The Structural Shift Behind the 2026 Rally
As of January 2026, Gold (XAU) is doing something that traditional economic models say it shouldn't be doing. It is smashing through all-time highs, eyeing $5,000, regardless of what the dollar or int
সম্পর্কিত আর্টিকেল

Analysis of Common Technical Indicators in the Cryptocurrency Market
In crypto trading, technical indicator analysis refers to a quantitative method that uses mathematical and statistical formulas to assess market trends. By processing price and volume data through spe

How to Quickly Draw Price Lines and High/Low Price Lines
In cryptocurrency trading, candlestick charts are an essential tool for traders' daily market analysis. Among them, the price line and high-low price lines are fundamental yet critical components of t

What is Parabolic SAR?
The Parabolic SAR (Stop and Reverse) is a widely used technical analysis tool designed to determine the direction of price trends and identify potential reversal points. This indicator plots a series

What is an Ichimoku Cloud Chart?
The Ichimoku Cloud Chart is a technical analysis method that combines multiple technical indicators into one chart. It can display potential support and resistance areas, trend direction, and provides
