

How to Use TradingView on MEXC
How to Use TradingView on MEXC
1. Setting Up the K-Line Chart
2. Common Drawing Tools
3. Using Technical Indicators
4. Time Zone Settings
5. Chart Settings
- Candles: Customize the candle colors, price line colors, precision, and time zone.
- Symbol: Settings for the text information at the top of the K-line chart, including whether to display OHLC values, bar change values, and volume.
- Labels: Offers various options to integrate labels into the chart, such as symbol name, high and low price, and countdown to bar close labels.
- Chart Basic Styles: Customize the chart's background color, grid line color, and other settings.
6. How to Reset the Chart
জনপ্রিয় আর্টিকেল

Solana Market Cap: Current Data, History, and What It Means for SOL Investors
Solana's market cap has ranged between $47 and $49 billion USD in early 2026, according to CoinMarketCap, making SOL one of the largest cryptocurrencies in the world.If you've ever wondered what that

Solana Sniper Bot: What It Is, How It Works, and Best Options
New tokens on Solana can go from zero to 10x in minutes — and manual traders almost always miss it.A Solana sniper bot is the tool serious traders use to get in before the crowd does.This guide breaks

Gold Price Prediction 2026: Stop Guessing Tops and Bottoms—A Top Trader's Macro Long/Short Strategy
At the start of every year, major Wall Street investment banks release massive reports predicting the prices of various assets. But as global gold prices historically breach the $5,000 mark in 2026, s

Mexc or Binance, Which Crypto Exchange Is Better for Buying Gold? The 2026 Macro Ecosystem Showdown
As the global price of gold decisively shatters the $5,000 per ounce milestone in 2026, countless crypto investors holding USDT are actively seeking refuge in the ultimate macro asset. Out of sheer ha
ট্রেন্ডিং নিউজ
আরও দেখুন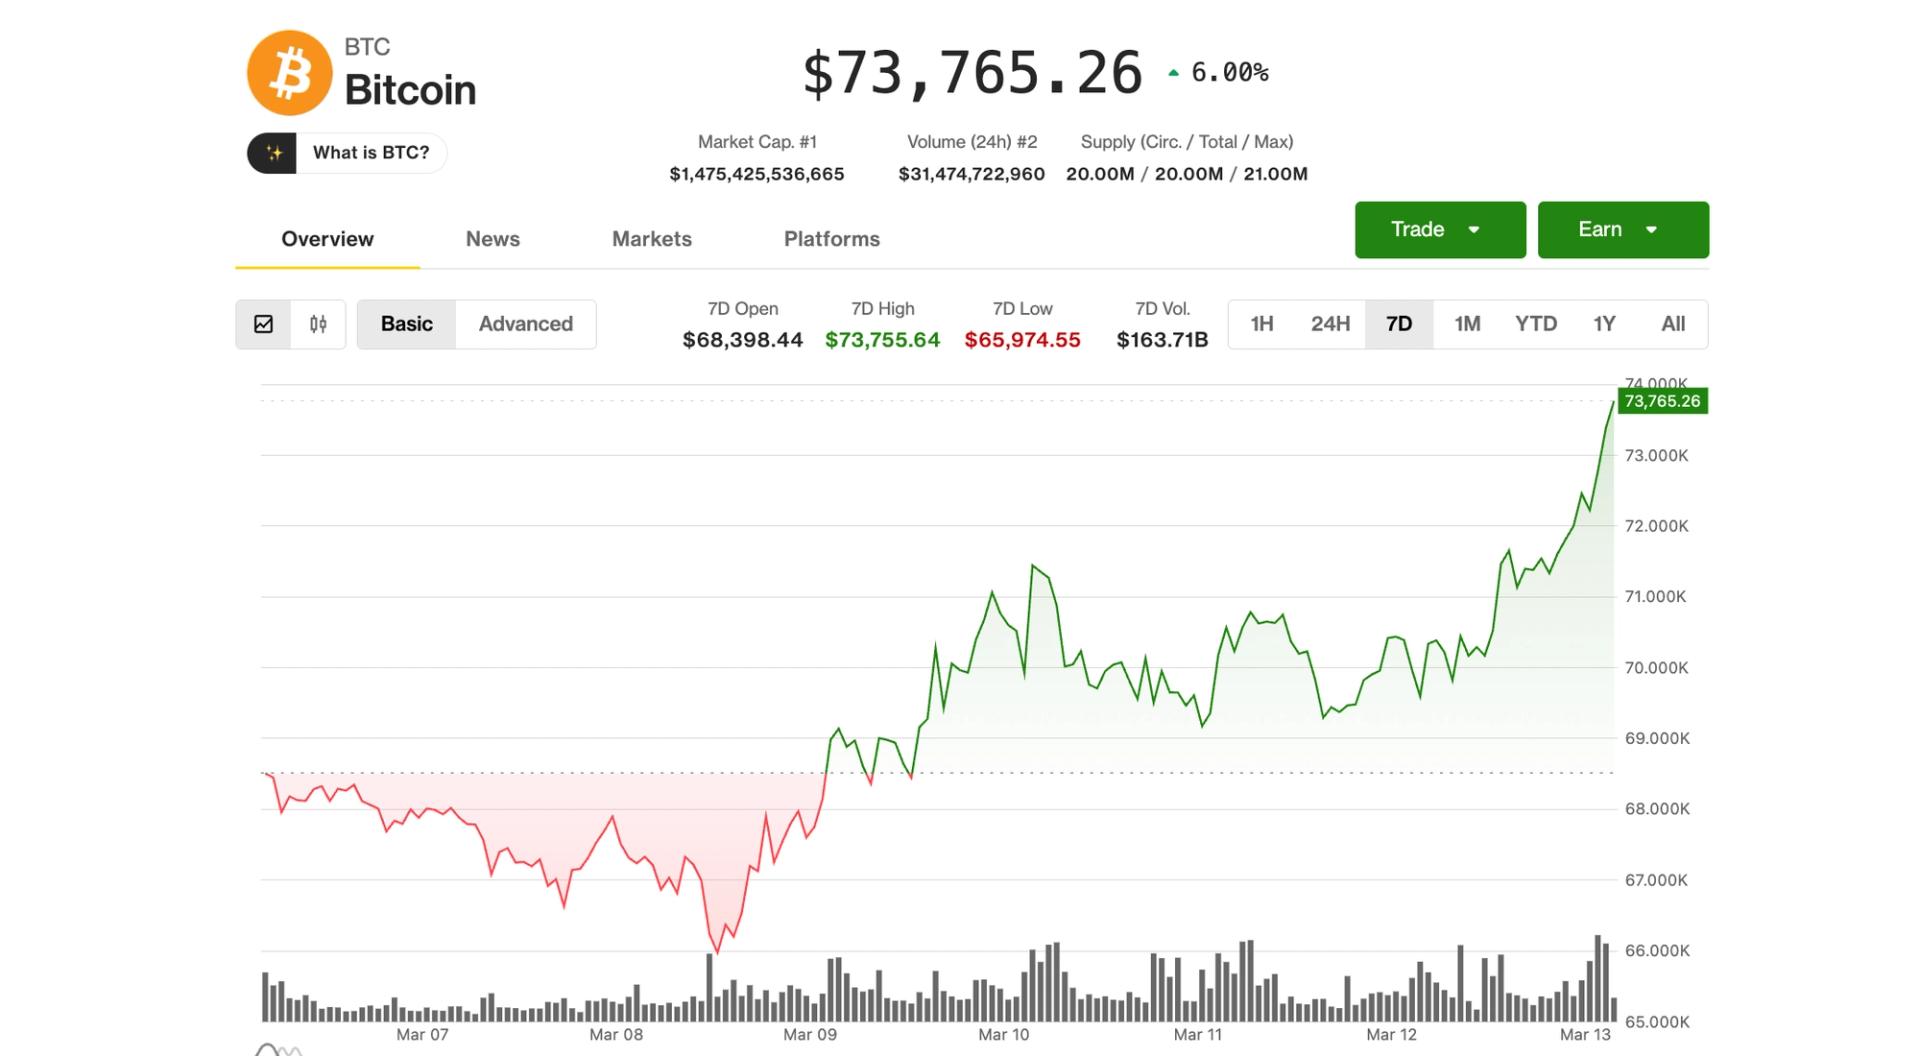
বিটকয়েন ইরান যুদ্ধ শুরুর পর থেকে ক্রমাগত ভালো পারফরম্যান্স অব্যাহত রেখে এক মাসের সর্বোচ্চ $73,800-এ পৌঁছেছে
``` মার্কেটস শেয়ার এই নিবন্ধটি শেয়ার করুন লিঙ্ক কপি করুনX (Twitter)LinkedInFacebookEmail Bitcoin এক মাসের সর্বোচ্চ $73,800-এ পৌঁছেছে, ```

ট্রাম্প 'আতঙ্কের পরিস্থিতিতে' নতুন প্রতিক্রিয়ায় 'বাইবেলীয় বিপর্যয়ের' ঝুঁকি নিচ্ছেন: তেল শিল্পের দিকপাল
একজন বৈশ্বিক অর্থ বিশেষজ্ঞ ট্রাম্প প্রশাসনকে সতর্ক করেছেন যে ইরানের বৈশ্বিক সরবরাহের হুমকির প্রতিক্রিয়ায় তেলের দাম কমাতে ঝুঁকিপূর্ণ পদক্ষেপ না নিতে

BlockDAG মূল্য পূর্বাভাস 2030: এখানে জানুন কেন BDAG আপনাকে 100x সুযোগ দিতে খুবই সাধারণ যা DeepSnitch AI লঞ্চের আগে অফার করছে
আন্তর্জাতিক টাস্ক ফোর্সগুলি অনিয়ন্ত্রিত অফশোর প্ল্যাটফর্মগুলির উপর তাদের নিয়ন্ত্রণ কঠোর করার সাথে সাথে, খুচরা ট্রেডাররা একটি কঠোর বাস্তবতার মুখোমুখি হচ্ছে: অন্ধকারাচ্ছন্ন, বিদেশী প্ল্যাটফর্মে অর্থ র
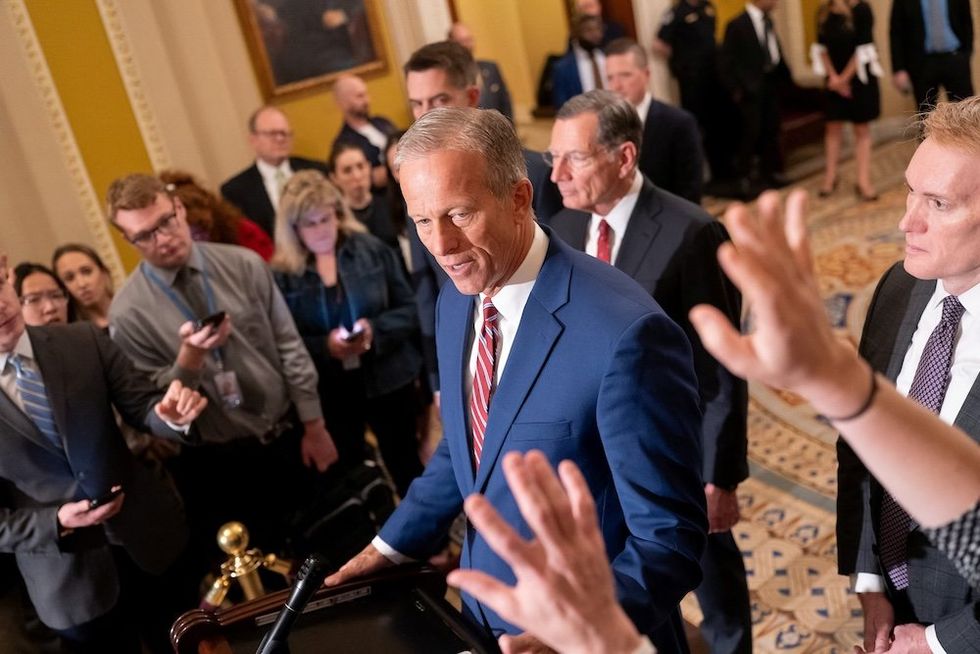
ট্রাম্প সিনেট সংখ্যা নিয়ে রিপাবলিকান নেতার প্রতি বিরক্ত
জিওপিতে একটি লড়াই তৈরি হচ্ছে। এর কেন্দ্রে রয়েছেন ডোনাল্ড ট্রাম্প এবং সিনেট সংখ্যাগরিষ্ঠ নেতা জন থুন, যেখানে প্রাক্তন সিনেট রিপাবলিকানদের পাস করার জন্য চাপ দিচ্ছেন
সম্পর্কিত আর্টিকেল
How to View MEXC Futures Account Assets and Open Positions For Improved Trading
Cryptocurrency futures trading has become popular among investors due to its flexibility and wide range of trading pairs. MEXC Futures, in particular, is well recognized by users for offering over 1,3

Analysis of Common Technical Indicators in the Cryptocurrency Market
In crypto trading, technical indicator analysis refers to a quantitative method that uses mathematical and statistical formulas to assess market trends. By processing price and volume data through spe
Common Technical Analysis Theories
Technical analysis is a widely used tool in financial investing, aimed at predicting future market trends by studying historical price movements and trading data. This article will break down the core

What is Parabolic SAR?
The Parabolic SAR (Stop and Reverse) is a widely used technical analysis tool designed to determine the direction of price trends and identify potential reversal points. This indicator plots a series
