

ChainLink (LINK) Technical Analysis: Bullish Momentum with Cautious Optimism

ChainLink (LINK) continues to demonstrate bullish momentum as key technical indicators signal a positive trajectory for this decentralized oracle network. Currently consolidating near the $13.51 price level, ChainLink's Moving Average Convergence Divergence (MACD) and Relative Strength Index (RSI) indicators both suggest strengthening buying interest. The MACD, which tracks the relationship between two moving averages of price, shows flattening patterns that hint at a potential recovery after recent consolidation, while the RSI remains in a balanced mid-range zone, neither oversold nor overbought. This combination reflects a market sentiment that is cautiously optimistic, positioning ChainLink for a possible upward breakout in the near term.
MACD and RSI Analysis
Diving deeper into the MACD and RSI analysis, the MACD indicator for ChainLink reveals a flattening trend, indicating that the recent downward momentum has slowed and a bullish crossover may be imminent. This suggests that buyers are gradually gaining control over the market. Meanwhile, the RSI, which measures the speed and change of price movements, currently sits near neutral levels around 50-60. This mid-range RSI reading indicates equilibrium between buying and selling pressures, reducing the likelihood of an immediate sharp reversal. Together, these signals point to a market that is consolidating but primed for a directional move, potentially breaking above critical resistance points.
Key Technical Parameters
When examining key technical parameters, ChainLink's price action is crucial. The token faces immediate resistance at approximately $14.93; a successful breach of this level could confirm renewed bullish momentum. The MACD position just below the signal line, paired with an RSI that has room to rise before becoming overbought, supports the possibility of such a breakout. The price consolidation around $13.51 offers a stable base, and if buying pressure intensifies, ChainLink could see a surge toward or beyond the resistance level. Traders and investors should watch these technical levels closely, as breaking above $14.93 may open the path for further upward movement.
Moving Average Trend Analysis
The moving average trend analysis provides additional insight into ChainLink's market strength. The 20-week Exponential Moving Average (EMA), currently at $11.379, acts as a key support level, reflecting substantial institutional accumulation. This EMA level has historically served as a strong foundation during price corrections, and its current position below market price indicates robust buying momentum. The upward slope of the 20-week EMA suggests sustained demand from long-term holders and institutions, reinforcing the bullish outlook. This support level offers a safety net that could prevent deeper price declines, giving investors increased confidence in ChainLink's intermediate-term prospects.
Moving Average Framework
A moving average framework across multiple timeframes further clarifies the current market environment. Short-term moving averages, such as the 10-day and 50-day EMAs, have recently aligned above longer-term averages like the 100-day and 200-day EMAs, producing a classic "golden cross" pattern indicative of bullish trend strength. This alignment signals that momentum is favoring buyers across various time horizons, creating a structured environment that supports upward price action. Such a framework typically attracts momentum traders and institutional investors who rely on moving averages to gauge market trends and entry points.
Monitoring Overbought Conditions
However, overbought conditions must be monitored carefully. The RSI surpassing the 70 threshold signals that ChainLink could enter an overbought phase, where prices might be due for a correction or a period of sideways consolidation. This scenario is common after strong rallies and indicates that market participants may be taking profits or pausing before the next leg up. Trading near established resistance zones, especially around $14.93 or higher, requires cautious positioning to manage risk and avoid potential drawdowns. Investors should consider these signals as part of a comprehensive risk management strategy, balancing the potential for gains with the possibility of short-term volatility.
Recent Market Dynamics
ChainLink's recent market dynamics have been characterized by significant volatility. Over the past 24 hours, the token experienced a decline of approximately -5.36%, reflecting rapid shifts in trader sentiment typical in overbought conditions. Such fluctuations underscore the importance of technical analysis in navigating the ChainLink market, where price swings can be swift and substantial. This volatility also demonstrates the token's sensitivity to broader market trends and news developments related to decentralized finance (DeFi) and oracle network adoption. Traders should remain vigilant and responsive to technical signals to capitalize on opportunities while mitigating risks.
Investment Prospects
Regarding investment prospects, ChainLink remains one of the most promising oracle networks in the blockchain space. Its core function is to provide secure, reliable, and tamper-proof real-world data to smart contracts across multiple blockchain platforms, a service vital for decentralized finance and other onchain applications. The ChainLink token's price forecasts for 2025 and 2030 vary among analysts, but the general consensus is optimistic due to ongoing institutional adoption and network expansion. While reaching the $100 milestone would require significant market growth and adoption beyond current levels, ChainLink's robust infrastructure and strategic partnerships position it well for substantial long-term appreciation.
Architecture and Partnerships
ChainLink's architecture, described extensively in its whitepaper, supports this bullish outlook by enabling hybrid smart contracts that combine on-chain and off-chain computational resources. This hybrid approach allows ChainLink to scale efficiently while maintaining high levels of security and decentralization. Moreover, ChainLink's partnerships with major financial institutions and DeFi protocols enhance its credibility and adoption potential. The network's continuous innovation in cryptoeconomic security and confidentiality further strengthens its value proposition, making it a key player in the evolving Web3 ecosystem.
Conclusion
In summary, ChainLink's technical indicators reflect a market poised for a bullish breakout, supported by strong moving average trends and a solid support base. However, overbought RSI levels and recent price volatility necessitate cautious trading near resistance levels. From a fundamental perspective, ChainLink's role as the industry-standard oracle platform and its expanding ecosystem underscore its long-term investment appeal. For investors and traders on MEXC, monitoring these technical and fundamental factors will be essential to navigating ChainLink's dynamic market environment effectively.
Description:Crypto Pulse is powered by AI and public sources to bring you the hottest token trends instantly. For expert insights and in-depth analysis, visit MEXC Learn.
The articles shared on this page are sourced from public platforms and are provided for reference only. They do not represent the position or views of MEXC. All rights belong to MEXC. If you believe any content infringes upon the rights of a third party, please contact [email protected] for prompt removal. MEXC does not guarantee the accuracy, completeness, or timeliness of any content and is not responsible for any actions taken based on the information provided. The content does not constitute financial, legal, or other professional advice, nor should it be interpreted as a recommendation or endorsement by MEXC. For expert insights and in-depth analysis, visit MEXC Learn.
Learn More About NEAR
View More
Gold Price Prediction 2026-2027: Can XAU Reclaim $5,000 After Falling Near $4,000?

USD/JPY Hits 162.50: Is Japan Finally Close to Yen Intervention?

Brent Crude Hovers Near $78: Strait of Hormuz Bottlenecks Clash With Macro Demand Resets
Latest Updates on NEAR
View More
SpaceX Options Surge: Turning IPO Momentum Into a Volatility Test

World Cup Most Clean Sheets Goalkeeper Prediction: Top GK Candidates, Clean Sheet Race and MEXC Event
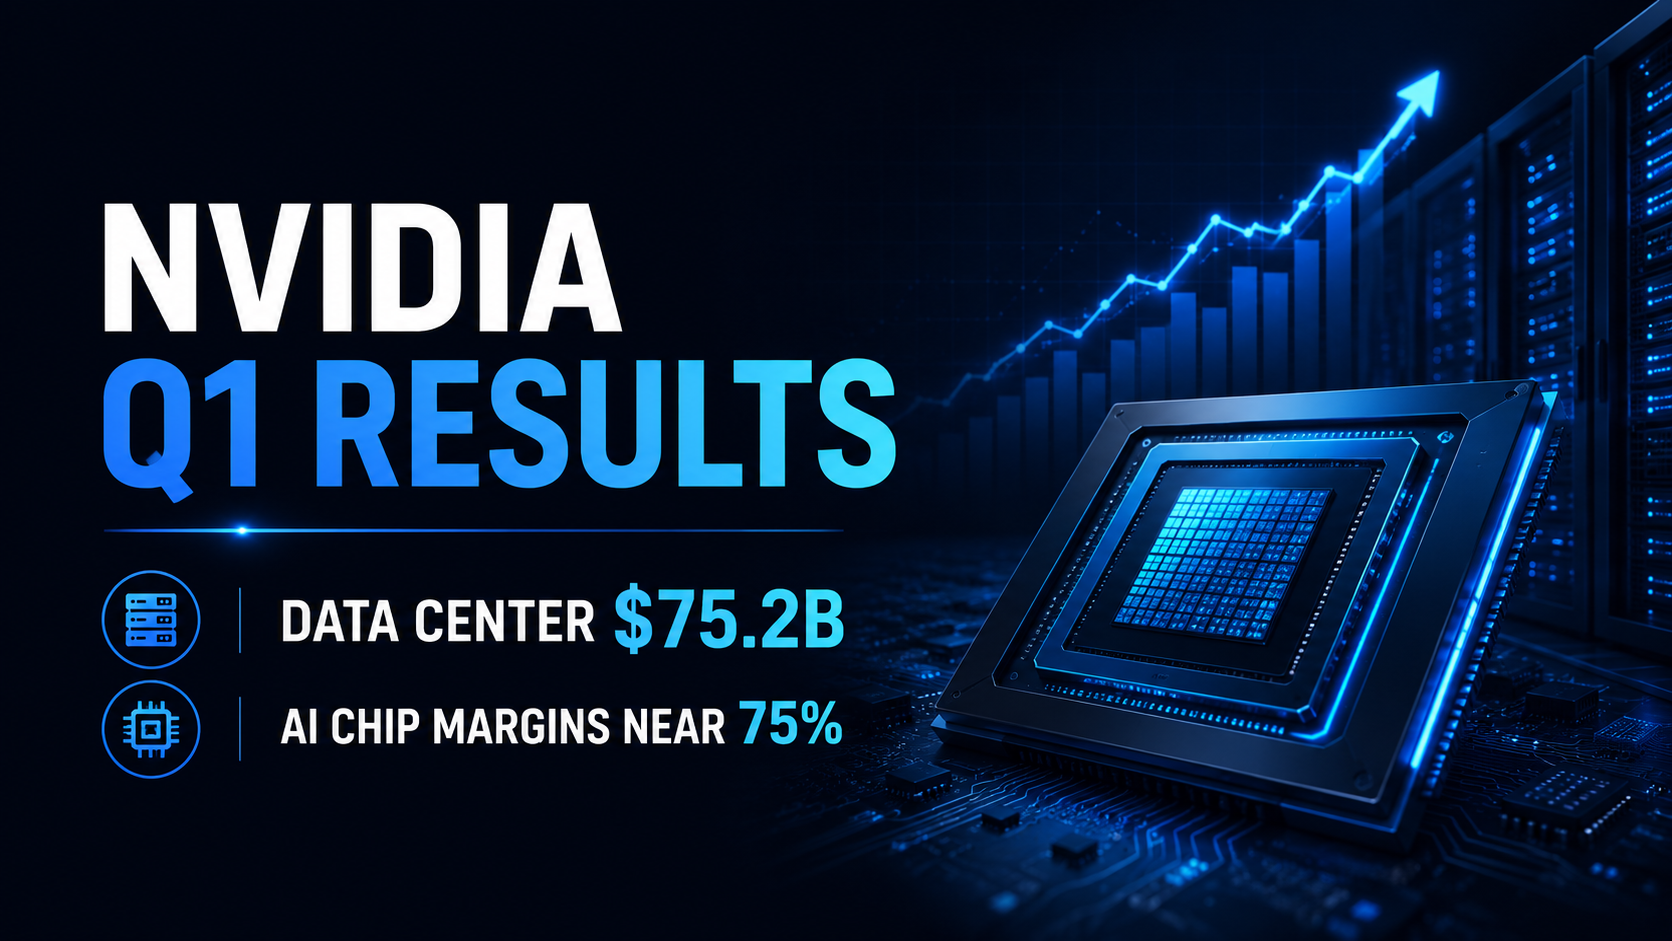
Nvidia FY2027 Q1 Earnings Review: Data Center Revenue Hits $75.2B as AI Chip Margins Hold Near 75%


HOT
Currently trending cryptocurrencies that are gaining significant market attention
Crypto Prices
The cryptocurrencies with the highest trading volume
Newly Added
Recently listed cryptocurrencies that are available for trading