Overview
As Chinese cloud artificial intelligence accelerator designer
Enflame officially initiates its public listing on the
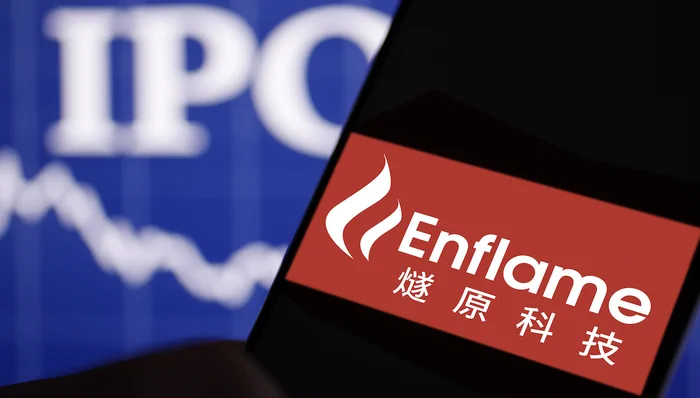
Shanghai Stock Exchange STAR Market under ticker 688801, secondary equity desks face an intense debate over capital formation multiples in indigenous compute hardware. Backed substantially by internet conglomerate
Tencent, Enflame established its initial public offering price at 142.18 yuan per share across 43.035173 million ordinary shares, targeting gross proceeds of approximately 6.119 billion yuan and establishing an initial market capitalization of 61.187 billion yuan (roughly $8.6 billion). According to reporting from
Reuters and
Bloomberg, this offering represents the highest public valuation ever awarded to an emerging domestic semiconductor compute designer, prompting institutional allocators to benchmark the asset against private market competitors Moore Threads and MetaX, as well as global industry leader Nvidia. With fiscal 2025 revenue approaching 1 billion yuan and forward projections indicating 2.3 billion to 3.0 billion yuan for the first three quarters of 2026, prospective market participants must evaluate whether a trailing price-to-sales multiple exceeding 60x represents a justifiable scarcity premium or an overextended valuation anchor.
Key Takeaways
Record capital formation establishes an industry pricing benchmark, with Enflame pricing its public offering at 142.18 yuan per share to achieve an initial market valuation exceeding 61 billion yuan, setting a structural anchor for domestic deep learning hardware equities.
Rapid top-line acceleration driven by data center deliveries, as corporate revenues expanded from approximately 292 million yuan in 2023 to 986 million yuan in 2025, alongside forward projections targeting between 2.3 billion and 3.0 billion yuan for the first three quarters of 2026.
Trailing price-to-sales multiple exhibits sharp divergence that narrows forward, trading at roughly 62x trailing sales compared to Nvidia multiples near 25x to 30x, though projected commercial deliveries throughout 2026 compress forward multiples toward the 18x to 22x range.
Heavy research capital expenditures and advanced packaging costs pressure margin durability, highlighted by a net loss of 1.164 billion yuan in 2025 as advanced lithography allocations, wafer fabrication fees, and specialized intellectual property royalties absorb operational cash.
Customer concentration and software stack maturity remain pivotal checkpoints, with strategic shareholder Tencent holding an approximate 20% equity stake while acting as a cornerstone customer, placing long-term operational retention on the execution of the proprietary TopsRider computing ecosystem.
The 61 Billion Yuan Pricing: Valuation Multiples and Capital Structure of Ticker 688801
The market valuation of 61.187 billion yuan established for Enflame under ticker 688801 illustrates how institutional order books across the STAR Market are evaluating accelerated computing supply chains.
Trailing Multiples and the Forward Compression Trajectory
Regulatory disclosures registered with the Shanghai Stock Exchange confirm that Enflame increased principal business revenue from 292 million yuan in 2023 to 986 million yuan in 2025, generating a compound annual growth rate of 83.76%. Assessed purely against historical 2025 billings, the implied price-to-sales ratio stands near 62x. Across mature international equity markets, such an elevated multiple is rarely awarded to hardware manufacturers operating with negative GAAP margins. However, underwriting syndicates and domestic institutional bidding desks have anchored their pricing on anticipated 2026 delivery schedules. With official guidance projecting between 2.3 billion and 3.0 billion yuan in revenue across the first three quarters of 2026 and full-year potential approaching 3.5 billion yuan, the forward price-to-sales multiple contracts toward 17x to 20x, bringing the valuation into alignment with hyper-growth global enterprise hardware peers.
Capital Allocation Priorities and R&D Cash Absorption
From the 6.119 billion yuan in gross proceeds, Enflame plans to deploy capital into next-generation training silicon, high-throughput distributed inference architectures, and high-speed cluster networking interconnects. Analysis published by the
Financial Times underscores that advancing deep learning processors toward leading process geometries requires substantial upfront non-recurring engineering expenses, photomask tooling, and electronic design automation licensing. Heavy structural investments resulted in a net loss of 1.164 billion yuan in 2025 and an additional loss of 632 million yuan during the first half of 2026, indicating that public capital must continue underwriting negative cash flows until manufacturing scale unlocks operational profitability.
Evaluating whether Enflame is richly valued requires a direct comparative framework against peer Chinese computing pioneers navigating the regulatory pipeline.
Architectural Breadth and the Moore Threads Valuation Gap
Compared with
Moore Threads, which completed pre-IPO tutoring with private market valuations estimated between 25 billion and 30 billion yuan, Enflame operates with a more concentrated enterprise compute focus. Moore Threads utilizes its proprietary MUSA architecture to target both enterprise compute and consumer graphics processing markets. While this dual architecture widens the total addressable commercial footprint, developing desktop graphics drivers introduces distinct software overhead. Enflame focused exclusively on cloud-based deep learning acceleration across its Cloudblazer training and inference systems, achieving commercial deployment in enterprise data centers ahead of broader diversified peers and justifying its premium valuation multiple over private venture rounds.
Another prominent domestic contender,
MetaX, was valued between 10 billion and 15.5 billion yuan during its private funding rounds before advancing through public listing tutoring. Founded by veteran semiconductor architects, MetaX specializes in its XiYun general-purpose computing platforms and XiSi inference modules, boasting strong theoretical floating-point performance specifications. However, in terms of volume deliveries across national intelligent computing centers and commercial cloud hubs, Enflame leveraged its early production ramp and deep commercial ties with internet operators to generate substantially higher top-line billings, securing an execution premium within public market order books.
Valuing Enflame Against Nvidia: Growth Premium vs Software and Margin Disparity
Institutional investors globally benchmark every accelerated hardware venture against market leader
Nvidia to assess valuation sustainability.
Structural Multiple Divergence and Differing Margin Realities
On the Nasdaq, Nvidia commands a market capitalization exceeding $3 trillion, typically trading between 25x and 35x sales while delivering operating profit margins above 60% and net margins exceeding 50%. Enflame trading at roughly 62x trailing sales appears visually expensive while generating persistent operational losses. This divergence highlights structural differences in market mandate. Global capital allocates to Nvidia based on established cash flow compounding and sovereign margin protection, whereas domestic public allocators on the STAR Market award strategic premiums to indigenous infrastructure assets capable of delivering local substitution. The imperative for enterprise data centers to secure diversified hardware access sustains elevated valuation tolerances across the domestic ecosystem.
Software Ecosystem Realities and the CUDA Competitive Moat
The foundational driver of enterprise valuation multiples resides in developer ecosystem defensibility. Nvidia maintains global dominance through its proprietary CUDA architecture, which has accumulated two decades of developer optimization. Research from
CNBC indicates that software execution latency and operator efficiency determine aggregate compute cluster economics. While Enflame engineered its proprietary TopsRider computing platform to support PyTorch and open-source orchestration engines, closing the execution gap with international standards requires extended cycles of developer code optimization and community tooling.
To manage market volatility and hedge risk across accelerated technology infrastructure assets, disciplined market participants utilize specialized derivative instruments.
Furthermore, liquidity metrics on
MEXC demonstrate sustained execution depth and cross-market participation across equities-linked digital assets during major technological public listing cycles.
Capex Burden and Supply Chain Bottlenecks: Advanced Packaging and Profitability Timelines
The long-term enterprise sustainability of any accelerated compute designer is governed by physical supply chain execution and structural margin retention.
High-Bandwidth Memory and Interconnect Procurement Ceilings
Designing high-performance accelerators requires balancing compute logic against physical memory bandwidth and inter-chip connectivity. Disclosures filed with the
U.S. Securities and Exchange Commission by global computing hardware peers indicate that High Bandwidth Memory and silicon interposer packaging represent over half of total hardware billings. In an environment characterized by supply allocation constraints, securing high-yield packaging allocations at competitive unit economics remains a persistent operational challenge. Without steady packaging cost deflation, expanding gross billings will struggle to translate into positive operating margins.
Managing Customer Concentration and Expanding Outside Tencent
Regulatory filings illustrate that
Tencent is both an essential early-stage strategic investor holding roughly 20% equity and a primary customer accounting for significant quarterly product deployments. While enterprise demand from Tencent established a dependable revenue baseline during early scaling phases, customer concentration introduces structural risks to revenue visibility. As public market reporting commences, Enflame must demonstrate its capacity to diversify sales channels across telecommunications carriers, banking data centers, and regional public computing hubs.
Cross-Asset Implications and Valuation Anchors Across Emerging Compute Markets
From a macro liquidity and multi-asset perspective, Enflame's public listing on the STAR Market carries broader systemic implications for global technology infrastructure.
Across decentralized physical infrastructure networks (DePIN) and distributed compute markets, hardware supply availability directly influences node provisioning costs and network token utility. A public valuation of 61 billion yuan for an indigenous accelerator provider establishes a baseline replacement cost for global compute nodes. It accelerates a broader transition where enterprise allocators evaluate compute assets based on effective workload execution, cluster telemetry, and electrical power efficiency rather than theoretical floating-point capabilities.
Investors assessing the long-term price stability of ticker 688801 should monitor several operational variables:
Sequential revenue expansion and gross margin preservation, verifying whether quarterly deliveries surpass 1 billion yuan while holding gross margins above forty-five percent.
Revenue diversification outside strategic accounts, observing commercial contract wins across state-owned telecommunications intelligent computing projects.
Supply chain continuity across advanced nodes, confirming that next-generation deep learning architectures successfully complete fabrication and packaging qualification milestones.
Exclusive View from James Mitchell
From a quantitative market structure and liquidity perspective, Enflame's 61 billion yuan public offering marks a high-stakes capital formation milestone driven by structural scarcity and strategic re-anchoring.
Market participants analyzing trailing sales multiples in isolation often label a 62x valuation as an ungrounded speculative bubble, overlooking the immense capital barriers and sovereign replacement mandates that characterize modern computing hardware. In an environment defined by physical component constraints, a commercial operator capable of deploying functional, multi-thousand-card data center clusters possesses a replacement value that cannot be captured by standard discounted cash flow models. Enflame's elevated valuation multiple prices in forward delivery expectations rather than current operational earnings. Forward guidance pointing toward 2.3 billion to 3.0 billion yuan across the first three quarters of 2026 establishes the numerical bridge required to compress its dynamic multiple toward historical technology averages. For active traders and macro portfolio managers, the primary risk is not the initial public valuation multiple, but rather whether advanced packaging constraints will disrupt volume shipment execution. The structural turning point will occur when the company must prove that its proprietary software ecosystem can run general-purpose large language models with enterprise-grade stability while generating positive free cash flow.
FAQ
Enflame priced its initial public offering on the Shanghai STAR Market under ticker 688801 at 142.18 yuan per share across 43.035173 million new shares, raising approximately 6.119 billion yuan and establishing an initial market capitalization of roughly 61.187 billion yuan.
Why is Enflame trailing price-to-sales multiple considered controversial?
Based on fiscal 2025 revenue of approximately 986 million yuan, Enflame commands a trailing price-to-sales ratio near 62x, significantly higher than Nvidia valuation multiples of 25x to 30x, while continuing to operate with net annual losses exceeding 1.16 billion yuan.
Enflame achieved commercialization and volume delivery across enterprise data centers earlier than its domestic peers, translating into superior near-term revenue. While Moore Threads pursues hybrid graphics and compute architectures and MetaX focuses on general-purpose GPU computing, Enflame established a specialized cloud acceleration pipeline supported by extensive production deployments.
What role does Tencent hold within Enflame operations and equity structure?
Tencent is an early strategic backer holding approximately 20% of corporate equity and represents one of Enflame's most significant enterprise customers, deploying its acceleration clusters across internal cloud computing and artificial intelligence workloads.
What are the primary operational risks facing investors in ticker 688801?
Key investment risks include ongoing GAAP operational losses, significant customer concentration centered on Tencent, supply chain allocations for advanced lithography and packaging, and developer switching friction associated with migrating code to the proprietary TopsRider software stack.
When will Enflame valuation multiples normalize toward historical hardware averages?
If the company achieves its forward financial guidance of generating between 3.0 billion and 3.5 billion yuan in total revenue during 2026, the forward price-to-sales multiple will rapidly compress from 62x to roughly 18x to 20x, bringing its enterprise valuation into line with global technology peers.
Disclaimer
The information, analysis, and views contained in this article are provided for general educational and informational purposes only and do not constitute financial advice, investment advice, legal advice, tax advice, or a recommendation to buy or sell any security, digital asset, or financial derivative. Equity securities and financial instruments are subject to high market volatility and capital risk. Past operational performance, financial results, and quantitative indicators do not guarantee future market returns. Investors must conduct independent due diligence and evaluate their personal financial situation, risk tolerance, and investment goals before executing any trade. The MEXC Crypto Pulse team assumes no liability for any direct or indirect financial losses resulting from the use of or reliance upon the information published herein.
About the Author
James Mitchell specializes in technical analysis, market trends, and trading strategies for both Bitcoin and altcoins. Based in London, he has over 10 years of experience in financial markets. Before joining MEXC Learn, James worked as a senior analyst at a leading European investment firm, where he developed expertise in risk management and quantitative trading. His transition to cryptocurrency markets began in 2017, and he has since become recognized for his data-driven approach. He holds a Master's degree in Financial Economics from the London School of Economics. His analytical approach combines traditional technical analysis with on-chain metrics to provide readers with actionable insights. Areas of expertise include technical analysis, market trends and cycles, trading strategies, Bitcoin and altcoin analysis, and risk management.
Research References