


What is Historical Price Analysis and Why It Matters for Holoworld AI (HOLO) Investors
Historical price analysis in cryptocurrency markets is a fundamental research methodology that examines past price movements to identify patterns, trends, and market behaviors that may inform future price action. For Holoworld AI (HOLO) investors, understanding the token's historical volatility patterns and key support/resistance levels provides essential context for making informed investment decisions. While past performance doesn't guarantee future results, historical analysis remains one of the most powerful tools in any crypto investor's arsenal. When studying Holoworld AI's price history, investors should focus on major market cycles, volume patterns during significant moves, and HOLO's reaction to external market events. This comprehensive approach helps identify potential entry and exit points and gauge market sentiment during different phases of Holoworld AI's evolution. By understanding how Holoworld AI (HOLO) has responded to previous market conditions, investors can better prepare for similar scenarios in the future.
Holoworld AI (HOLO)'s Journey: Key Price Milestones and Market Phases
Holoworld AI (HOLO) is a decentralized application hub for artificial intelligence agents, applications, and digital intellectual properties (IPs), launched in 2022 in Silicon Valley. Its early days were characterized by relatively low liquidity and modest trading volume, typical for new cryptocurrency projects. The first significant price movement occurred in September 2025, when Holoworld AI was listed on MEXC, opening trading for HOLO/USDT and HOLO/USDC pairs. On its first day of active trading, Holoworld AI's price ranged from $0.05 to $0.7686, reflecting substantial price volatility and strong market interest. This initial surge was driven by the MEXC listing, zero trading fee incentives, and an airdrop event. The Holoworld AI (HOLO) token's all-time high and low are not yet established due to its recent launch, but the early trading window has already set critical support and resistance levels for future analysis.
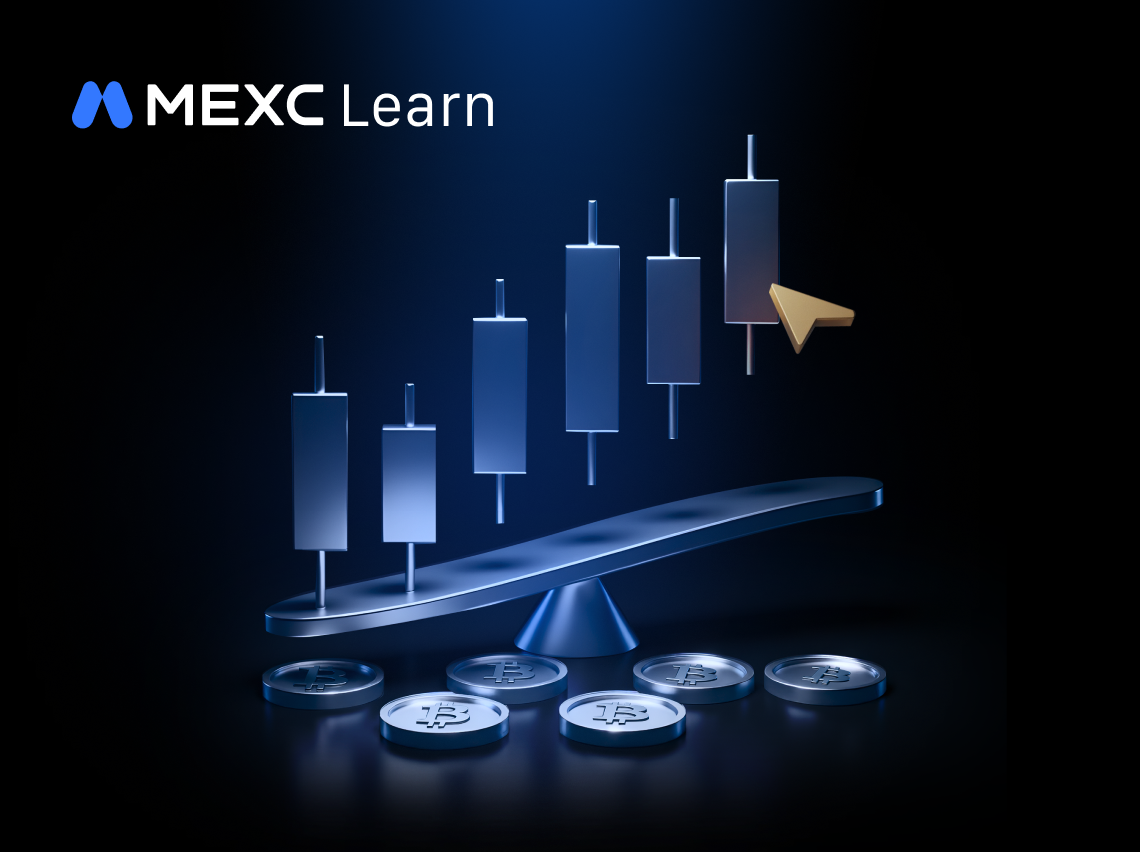
Technical Analysis of Holoworld AI (HOLO)'s Historical Chart Patterns
Throughout its brief trading history, Holoworld AI (HOLO) has displayed recurring technical patterns that technical analysts monitor closely. The most notable pattern so far has been sharp volatility spikes during major events, such as the MEXC listing and associated promotional activities. On the intraday and daily charts, Holoworld AI has established key support levels at $0.05 and $0.45, which have acted as price floors during corrections. Resistance levels have formed near $0.77, which has proven challenging to overcome, requiring exceptional market momentum and volume for HOLO to break through. As the token matures, the long-term trendline connecting Holoworld AI's major lows since inception will provide a critical benchmark for identifying potential trend reversals and serve as a fundamental reference point for technical analysts.
External Factors That Shaped Holoworld AI (HOLO)'s Price History
Holoworld AI (HOLO)'s price history has been significantly influenced by broader cryptocurrency market trends, with a notably strong correlation to major market events during its launch period. This correlation is expected to decrease over time as HOLO establishes its unique value proposition and user base. Regulatory developments, such as favorable listing conditions and compliance with MEXC's standards, have played a decisive role in Holoworld AI's price trajectory. Additionally, Holoworld AI (HOLO)'s price has responded positively to technological advancements, particularly the launch of its decentralized AI application hub and the introduction of new features and partnerships. These milestones have enhanced the platform's utility and visibility, resulting in substantial price appreciation during key events.
Historical Volatility Compared to Other Cryptocurrencies
When compared to other cryptocurrencies, Holoworld AI (HOLO) has exhibited distinctive volatility characteristics. During its early stages, Holoworld AI experienced volatility levels significantly higher than established assets like Bitcoin, which is typical for emerging digital assets. As the project matures, its volatility is expected to gradually decrease, aligning more closely with market benchmarks. Analysis of HOLO's historical data reveals noticeable seasonal patterns, with higher volatility typically occurring during major listing events and promotional periods. This seasonality correlates with increased trading volume during these periods, suggesting that larger market participants may be more active during these timeframes. Furthermore, Holoworld AI (HOLO) is likely to demonstrate a distinct market cycle characterized by accumulation phases, rapid price appreciation, distribution, and correction periods, providing a potential framework for anticipating future market phases.
Conclusion
The historical price analysis of Holoworld AI (HOLO) offers several valuable insights for investors. First, the token has demonstrated resilience following major market corrections, typically recovering a significant portion of losses within days of high-volume events. Second, accumulation periods characterized by low volatility and steady volume have historically preceded major upward price movements. To transform these historical insights into effective trading strategies, explore our 'Holoworld AI (HOLO) Trading Complete Guide: From Getting Started to Hands-On Trading.' This comprehensive resource provides practical frameworks for executing trades based on historical patterns, risk management techniques tailored to Holoworld AI's volatility profile, and step-by-step instructions for both beginners and experienced traders.
Description:Crypto Pulse is powered by AI and public sources to bring you the hottest token trends instantly. For expert insights and in-depth analysis, visit MEXC Learn.
The articles shared on this page are sourced from public platforms and are provided for informational purposes only. They do not necessarily represent the views of MEXC. All rights remain with the original authors. If you believe any content infringes upon third-party rights, please contact [email protected] for prompt removal.
MEXC does not guarantee the accuracy, completeness, or timeliness of any content and is not responsible for any actions taken based on the information provided. The content does not constitute financial, legal, or other professional advice, nor should it be interpreted as a recommendation or endorsement by MEXC.
Learn More About Gensyn
View More
MEXC AI Strategy for Beginners: How AI Quant Trading Works
Trump-Xi Beijing Summit 2026: How China Is Shaping Global Markets, Oil and AI

Ethereum AI Agent Thesis Gains Momentum as Tokenization Demand Returns to Focus
Latest Updates on Gensyn
View More
Ads3 Taps ENI to Accelerate AI-Driven Adoption of Web3 Infrastructure

Acuity Analytics Launches Domain-Led Agentic AI Platform to Help Financial Institutions Move from Experimentation to Enterprise Value

AI QA vs AI Security Testing: Why LLM Apps Need Both Before They Scale
HOT
Currently trending cryptocurrencies that are gaining significant market attention
Crypto Prices
The cryptocurrencies with the highest trading volume
Newly Added
Recently listed cryptocurrencies that are available for trading