Lululemon just had one of its worst trading days in years. Shares closed at $100.61, down $21.16, or -17.38%, after the company reported second-quarter results that beat on a tariff-inflated headline EPS number but missed on revenue, and then cut its full-year guidance for the third time in fiscal 2026. The stock touched an intraday low near $98, its lowest level since 2018, before recovering slightly into the close.
The damage isn't limited to one bad day. LULU is now down roughly 49.65% over the past year and has fallen 17.44% in the past month alone, almost entirely on today's single session. This is a stock in the middle of a full-blown fundamental reassessment, not a routine pullback, and the technical picture reflects that: the composite rating has moved to Strong Sell across every major timeframe read here.
Here is what the chart, the oscillators, and the moving averages are actually saying right now.
Price Action: A Slow Bleed, Then a Cliff
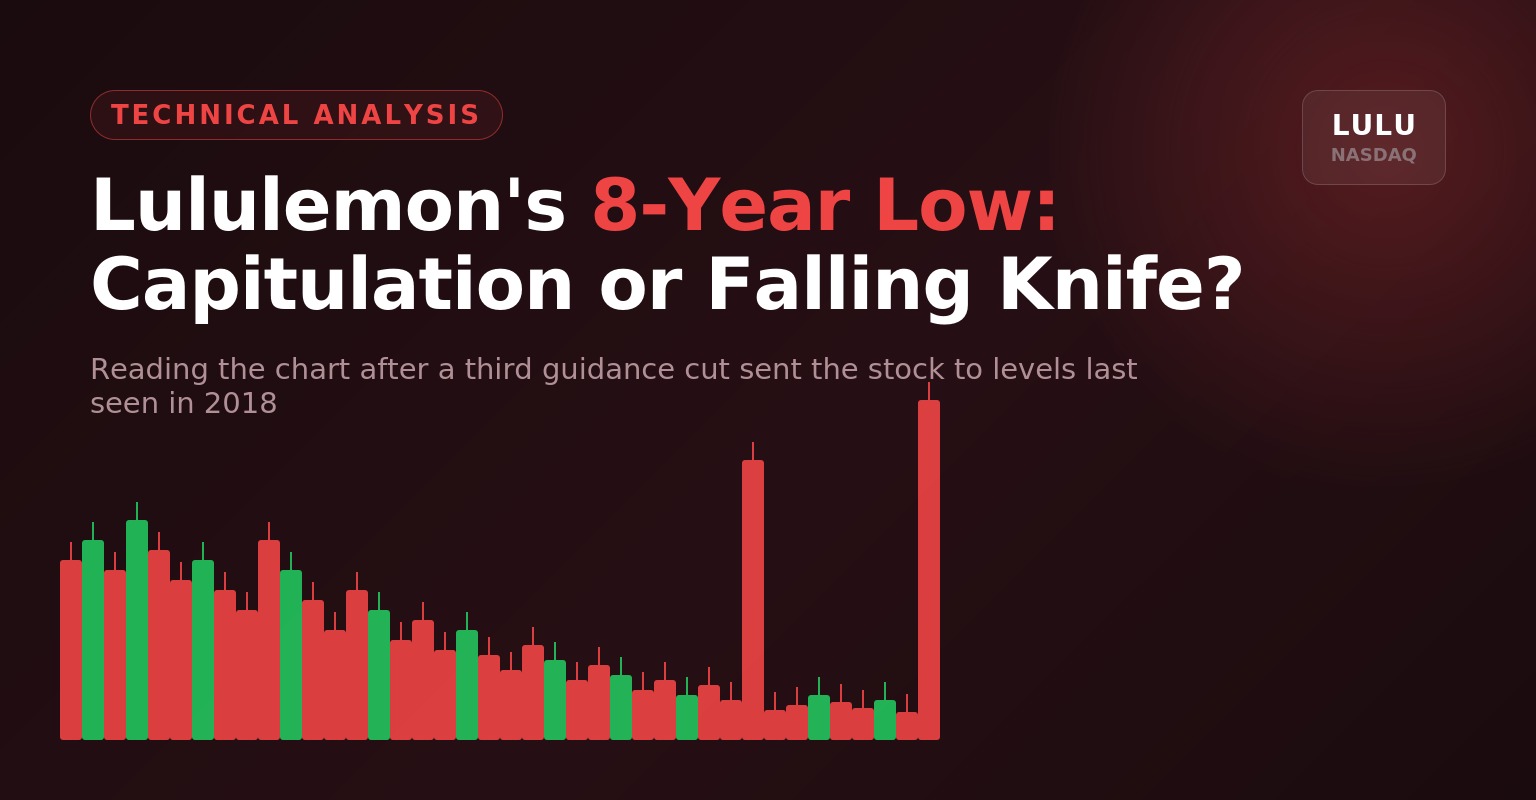
LULU closed at $100.61, down 17.38% on the day. Zooming out to the one-year chart, the stock has been in a persistent downtrend since peaking above $220 roughly a year ago, grinding lower through a series of lower highs and lower lows. But today's move was categorically different from the slow bleed that preceded it: a single-day gap and drop of this size is a repricing event, not incremental drift.
The one-month chart makes the contrast obvious. Shares had been chopping in a relatively contained $118 to $130 range for most of August, then gapped straight down through that entire range in one session following the earnings release after the close on September 3. There was effectively no transition, the stock moved from consolidation to an 8-year low in a single candle.
One-year daily candlestick chart, LULU. Chart from TradingView.
Support and Resistance
Because today's crash gapped price straight through the levels that would normally define nearby support, the standard pivot calculations, built from the prior day's range, are now stale. The classic pivot's first support level, $113.68, sits well above where the stock actually closed, which tells you how violent the move was rather than where support now lies.
The more relevant reference points are the intraday low near $98 (the stock's worst level since 2018) and the psychologically significant $100 mark it closed just above. Below that, there is limited recent chart history to anchor to, since the stock hasn't traded in this zone in eight years, which is itself a sign of how unusual this level is. On the upside, the $110 to $114 area, the bottom of the pre-earnings trading range, is now the first realistic resistance shelf, with the broader $118 to $130 range serving as a much heavier ceiling above that.
Technical summary gauges, LULU. Chart from TradingView.
Technical Ratings: Strong Sell Across the Board
The composite technical summary currently reads Strong Sell, with 17 sell signals against 9 neutral readings and zero buy signals among the indicators tracked. Both the oscillator group and the moving average group confirm the same picture, moving averages in particular are almost uniformly bearish, with 14 sell readings against a single neutral and no buy signals at all.
Category | Reading |
Overall Summary (1-day) | Strong Sell (Sell 17, Neutral 9, Buy 0) |
Oscillators | Sell (Sell 3, Neutral 8, Buy 0) |
Moving Averages | Strong Sell (Sell 14, Neutral 1, Buy 0) |
Current price | $100.61, -17.38% at close |
It's worth separating this from the fundamental analyst picture, which tells a noticeably different story. Wall Street's average rating sits at Neutral, based on 36 analysts, with the bulk of coverage (28 of 36) sitting at Hold rather than a clear directional call. The average 12-month price target is $101.53, barely above where the stock just closed, though the dispersion between individual targets is enormous.
Category | Reading |
Wall Street rating (36 analysts, 3mo) | Neutral (Strong Buy 3, Buy 1, Hold 28, Sell 0, Strong Sell 4) |
Average 1-year price target | $101.53 (+0.92% from current) |
Price target range (24 analysts) | $44.00 low to $130.00 high |
That $44 to $130 target range is unusually wide for a company this size, and it reflects real disagreement about whether Lululemon's turnaround, now inherited by incoming CEO Heidi O'Neill, can work. The technical picture is unambiguously bearish in the near term. The fundamental picture is genuinely split.
Deeper Technical Read
Trend structure.
The one-year chart shows a textbook long-term downtrend, a series of lower highs since the peak near $220, with today's crash simply accelerating a pattern that was already well established. Every major moving average, from the 10-day up through the 200-day, is now reading Sell, and the longer-dated averages (100-day at 128.25, 200-day at 152.77) sit far above current price, underscoring how far below trend the stock has fallen.
Momentum.
RSI(14) sits at 31.79, in oversold territory but not yet at an extreme, and is still classified Neutral by the platform's own threshold. MACD and the 10-day Momentum indicator are both firmly in Sell territory, at -1.52 and -20.46 respectively, consistent with a market that has just absorbed a genuine shock rather than one that is merely due for a technical bounce.
Volume.
Volume on the crash session was roughly 1,000% above the stock's three-month average, according to reporting on the move, which is the signature of forced and panic selling rather than orderly distribution. That kind of volume spike can mark either the start of a longer decline or, eventually, a capitulation low, but one oversized volume day is not enough on its own to distinguish between the two.
Moving averages.
Every moving average tracked here, short-term and long-term alike, currently reads Sell, with the sole exception of the Ichimoku Base Line, which sits at Neutral. That kind of uniform alignment across timeframes is unusual and reflects the size of today's gap more than a change in underlying trend, price didn't drift below these averages, it gapped through nearly all of them in a single session.
Two Scenarios From Here
Bullish case (relief bounce): Heavy selling volume like today's is sometimes a capitulation signal. If price stabilizes above the $98 intraday low and reclaims the $110 to $114 zone on a closing basis, that would be an early sign the worst of the technical damage is priced in, even if the fundamental turnaround remains unproven.
Bearish case (continuation): A stock that just gapped down through its entire recent trading range on 10x average volume is exhibiting classic distribution behavior. If price fails to hold above $98, there is very little recent chart history to define the next support level, since LULU hasn't traded this low since 2018, and the decline could continue with limited technical resistance until new buyers step in.
The Bigger Question
The technical read here is about as one-sided as this kind of scorecard gets, Strong Sell on the composite, Strong Sell on moving averages, Sell on oscillators, and essentially no support levels nearby that have actually been tested at these prices. That is a very different setup from a stock correcting off recent highs, this is a stock being repriced by the market in real time in response to a fundamental deterioration in the business.
The fundamental story explains why: a third guidance cut in fiscal 2026, full-year EPS guidance slashed to $9.48 to $9.73 from a prior $10.95 to $11.15, a Q3 revenue outlook implying another 10% to 11% decline, and comparable sales weakness concentrated in the leggings category that built the brand in the first place. Layer on an unrelated governance overhang, founder Chip Wilson's roughly 9% stake and his ex-wife Shannon Wilson's roughly 1% stake are both potentially in play amid their divorce, and incoming CEO Heidi O'Neill inherits a business with very little room for further disappointment.
Off to you: is this the kind of capitulation volume that marks a bottom, or the start of a longer re-rating for a brand that's genuinely losing share?
Frequently Asked Questions
Why did Lululemon stock crash 17% today?
Lululemon reported Q2 fiscal 2026 results after the close on September 3. Revenue came in below analyst estimates, and management cut full-year revenue guidance to a 5% to 7% decline (from a prior forecast of flat to down 1%) and cut full-year EPS guidance to $9.48 to $9.73 (from $10.95 to $11.15). It was the company's third guidance cut of the fiscal year, and the market punished the outlook far more than it rewarded the tariff-assisted EPS beat.
Is LULU oversold after this drop?
Partially. RSI(14) at 31.79 is approaching oversold territory but is not yet at a historic extreme, and the platform's own reading still classifies it as Neutral rather than Oversold. The bigger signal is the composite Strong Sell rating and the fact that essentially every moving average, short and long-term alike, is aligned bearish, which is a broader and more decisive signal than a single oscillator reading.
What is the next resistance level for LULU stock?
The $110 to $114 zone, the lower boundary of where the stock traded through most of August before the crash, is the first realistic resistance shelf. Above that, the broader $118 to $130 range that held for weeks pre-earnings is a much heavier ceiling that would require a significant fundamental catalyst to reclaim.
What is the key support level to watch?
The intraday low near $98, the worst level the stock has traded at since 2018, is the level to watch. Because there is essentially no recent trading history below current prices, a break of $98 would put the stock into territory with very little established technical support, and price discovery could move quickly in either direction.
Does the Chip Wilson divorce affect the stock?
It adds a governance overhang on top of the operational problems. Lululemon founder Chip Wilson holds roughly a 9% stake and his ex-wife Shannon Wilson holds roughly 1%, and their divorce raises questions about potential ownership changes, though the operational and guidance issues are the primary drivers of today's move, not the divorce itself.
Is this analysis financial advice?
No. This is a technical read of the chart for informational and educational purposes only. It does not account for your personal financial situation, risk tolerance, or goals, and it is not a recommendation to buy or sell any security.
Disclaimer: This analysis is for informational and educational purposes only and does not constitute financial, investment, or trading advice. Technical levels and ratings are derived from a snapshot of trading app data and are approximate, verify current levels on a live chart before making any decisions. Past performance does not guarantee future results.