


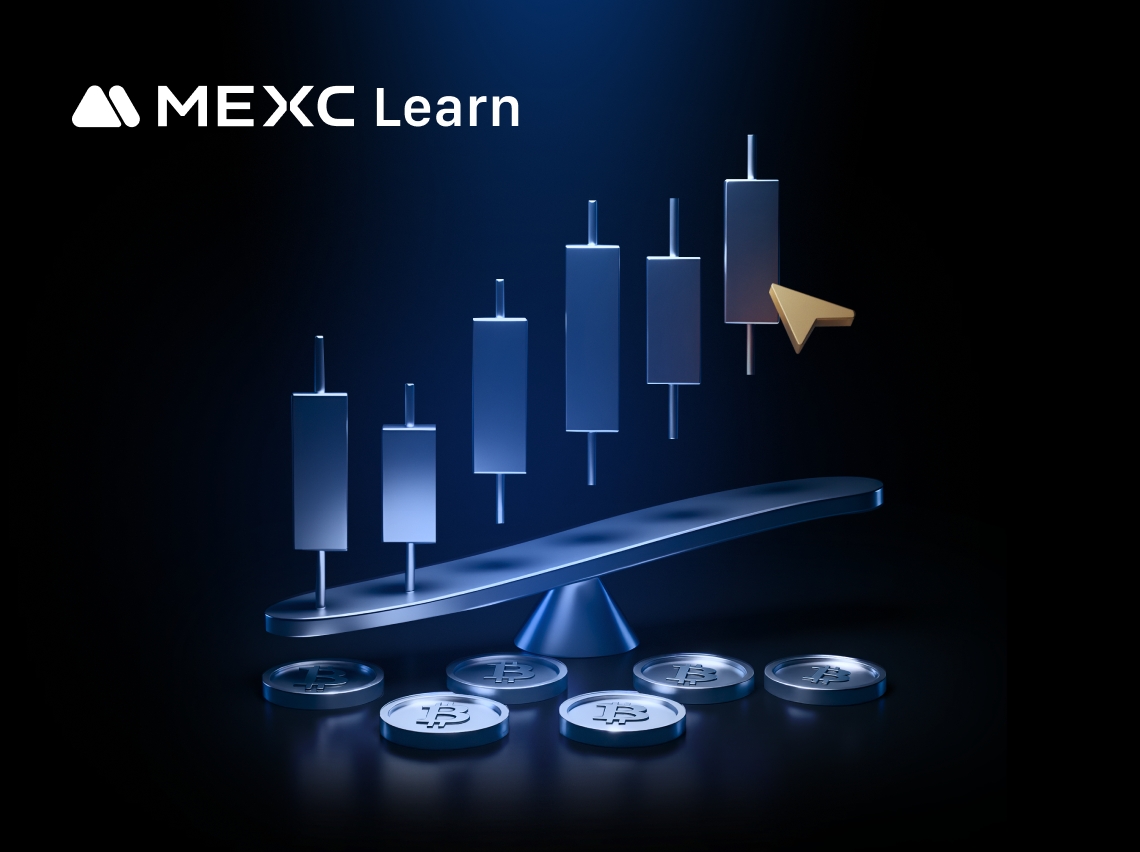
The historical Meteora (MET) price data provides a clear view of how the Meteora token has performed over time. By analyzing past MET price movements, traders can identify trends, measure volatility, and make more informed decisions about future trading or investment in the Meteora ecosystem.
MET Historical Price Overview
Over its history, Meteora (MET) has experienced significant ups and downs. Key metrics include:
- All-Time High (ATH): $1.00 on October 23, 2025
- All-Time Low (ATL): $0.50 on October 23, 2025
- Market Cap at ATH: Approximately $1 billion fully diluted valuation (FDV)
- Market Cap at ATL: Approximately $500 million FDV (inferred from ATL and circulating supply)
The Meteora token saw rapid growth in pre-market trading, opening at a $1.8 billion valuation before stabilizing at $1 billion FDV as the broader altcoin market corrected. The Meteora launch was marked by the immediate release of 48% of the total supply, a radical approach that created both excitement and volatility in the Solana ecosystem.
MET 30-Day, 90-Day, and Year-to-Date Performance
Recent Meteora performance helps gauge short- and mid-term trends:
- 30-Day Price Change: Not applicable (Meteora token launched October 23, 2025)
- 90-Day Price Change: Not applicable (Meteora token launched October 23, 2025)
- Year-to-Date (YTD) Change: Not applicable (Meteora token launched October 23, 2025)
As MET is a newly launched token, historical performance data for 30-day, 90-day, and YTD periods is not yet available. However, the initial Meteora trading window has shown high volatility, with MET prices ranging from $0.50 to $1.00 in the first day, reflecting both speculative interest and the impact of the unique Meteora token distribution model.
Notable Meteora Historical Events Affecting Price
Historical events often shape Meteora token performance:
- Token Generation Event (TGE) on October 23, 2025 → Immediate release of 48% of Meteora supply led to high volatility and price discovery.
- Airdrop to Early Users and LPs → Large-scale distribution to Meteora community members created initial sell pressure but also broadened token ownership.
- Launch of New Product Suite (DLMM v2, Presale Vaults, Meteora Invent) → Expanded Meteora protocol utility and attracted new users, supporting MET price stabilization post-launch.
Market sentiment following the Meteora TGE was mixed: some traders anticipated a MET price collapse due to the large circulating supply, while others saw the event as a model for fair and transparent Meteora token launches. The introduction of new protocol features coincided with the TGE, helping to anchor Meteora value and attract liquidity.
Patterns & Trends in MET Price History
By examining charts and historical data, traders can spot recurring Meteora trends:
- Volatility spikes occurred during the TGE and airdrop claim period, as large numbers of Meteora tokens entered circulation.
- Correlation with Solana ecosystem activity: MET's price and trading volume surged during periods of high Solana DEX usage, particularly when major memecoins launched liquidity pools on Meteora.
- No clear seasonal cycles yet, given the Meteora token's recent launch, but price action has been closely tied to protocol upgrades and community events.
Meteora price often reacts sharply to protocol news and product launches, with the potential for further volatility as the remaining Meteora supply unlocks and new features are deployed.
Lessons from MET Historical Price Data
Historical Meteora price data is more than numbers; it provides actionable insights for traders and investors. By studying past performance, you can:
- Understand potential risk and reward, seeing how Meteora (MET) reacts during periods of high supply influx and protocol innovation.
- Recognize key support and resistance levels—for example, the $0.50–$1.00 range established during the first day of Meteora trading.
- Identify periods of high momentum or consolidation, such as the immediate post-TGE window, which may signal future breakout or correction opportunities for MET.
- Gain contextual understanding of Meteora price movements relative to major Solana ecosystem events, protocol upgrades, and broader market trends.
Over the past 12 months, Meteora's protocol has shown resilience, rebuilding after the FTX collapse and prioritizing transparency in token distribution. The unique approach to instant liquidity and community allocation has set new precedents, with MET price surges often following major network upgrades and product launches.
Conclusion
Analyzing the historical price of Meteora (MET) helps traders and investors understand past behavior and plan future actions more confidently. MEXC provides accurate historical data and charts to track Meteora's journey from its earliest trades to the present.
Description:Crypto Pulse is powered by AI and public sources to bring you the hottest token trends instantly. For expert insights and in-depth analysis, visit MEXC Learn.
The articles shared on this page are sourced from public platforms and are provided for informational purposes only. They do not necessarily represent the views of MEXC. All rights remain with the original authors. If you believe any content infringes upon third-party rights, please contact [email protected] for prompt removal.
MEXC does not guarantee the accuracy, completeness, or timeliness of any content and is not responsible for any actions taken based on the information provided. The content does not constitute financial, legal, or other professional advice, nor should it be interpreted as a recommendation or endorsement by MEXC.
Learn More About Meteora
View More
What Is Meteora Solana? The DLMM Liquidity Protocol Explained
How to Trade TSLA Earnings Volatility: Profit from Price Swings on MEXC

What is Meteora? A Comprehensive Overview of Solana's Dynamic Liquidity Pool Protocol
Latest Updates on Meteora
View More
PHL, Myanmar boost fight vs crime

Epstein survivors hit Trump DOJ chief with major fact check: 'He has not met with us'

Fashion Tech Founder John Imah Emerges as One of the Most Intriguing Bachelors in the Culture Scene
HOT
Currently trending cryptocurrencies that are gaining significant market attention
Crypto Prices
The cryptocurrencies with the highest trading volume
Newly Added
Recently listed cryptocurrencies that are available for trading