Introduction
Airbnb, Inc. (NASDAQ: ABNB) has delivered one of the more dramatic technical turnarounds among large-cap growth names, with ABNB stock up over 53% in the past year and 26% in just the past month. For traders and investors trying to make sense of ABNB stock price action after such a sharp run, a structured ABNB technical analysis offers a clearer picture than headlines alone. This article breaks down the ABNB stock chart using data pulled directly from TradingView, covering moving averages, momentum oscillators, pivot levels, and analyst price targets, so you can understand where Airbnb stock stands technically and what key levels to watch next.
This is a technical analysis article, meaning the focus is on price behavior, chart patterns, and indicator readings rather than a deep dive into company fundamentals. Whether you are tracking ABNB stock for a swing trade, evaluating an existing position after its recent breakout, or searching for an ABNB stock price prediction based on chart signals, this breakdown of Airbnb's technical setup is designed to be straightforward and easy to follow.
Data last updated: August 13, 2026, based on the most recent TradingView chart data available at time of writing.
Key Highlights
ABNB closed at $184.06, down $1.07 (-0.58%) in the latest session, with pre-market trading showing further softness at $183.02.
The stock has surged 53.37% over the past year and 26.3% over the past month, driven by a sharp late-session breakout above $180.
TradingView's technical summary rates ABNB a "Buy" overall, with Moving Averages at "Strong Buy" while Oscillators register a "Sell" signal.
Every tracked moving average from the 10-day through the 200-day is in Buy territory except the 9-day Hull Moving Average, which is the lone Sell signal at $190.05.
The Relative Strength Index sits at 74.99, just above the overbought threshold of 70, a sign the recent rally may be due for a pause or pullback.
Classic pivot analysis places immediate resistance near $160.11 and support near $147.91, though the stock has already broken well above these older pivot levels following its recent surge.
Wall Street analysts maintain an overall "Buy" consensus on ABNB from 46 analysts, though the average 12-month price target of $175.53 is actually below the current price, implying limited near-term upside on a purely fundamental basis.
ABNB Stock Price Today: Chart Overview
Airbnb shares recently closed at $184.06, down 0.58% in a single session, a modest pullback after an extraordinary run. Pre-market activity showed further softness, with the stock trading at $183.02. Zooming out to the one-year view, ABNB has delivered a 53.37% return, but the shape of that gain is what makes the chart particularly interesting: much of it came in a concentrated burst rather than a steady climb.
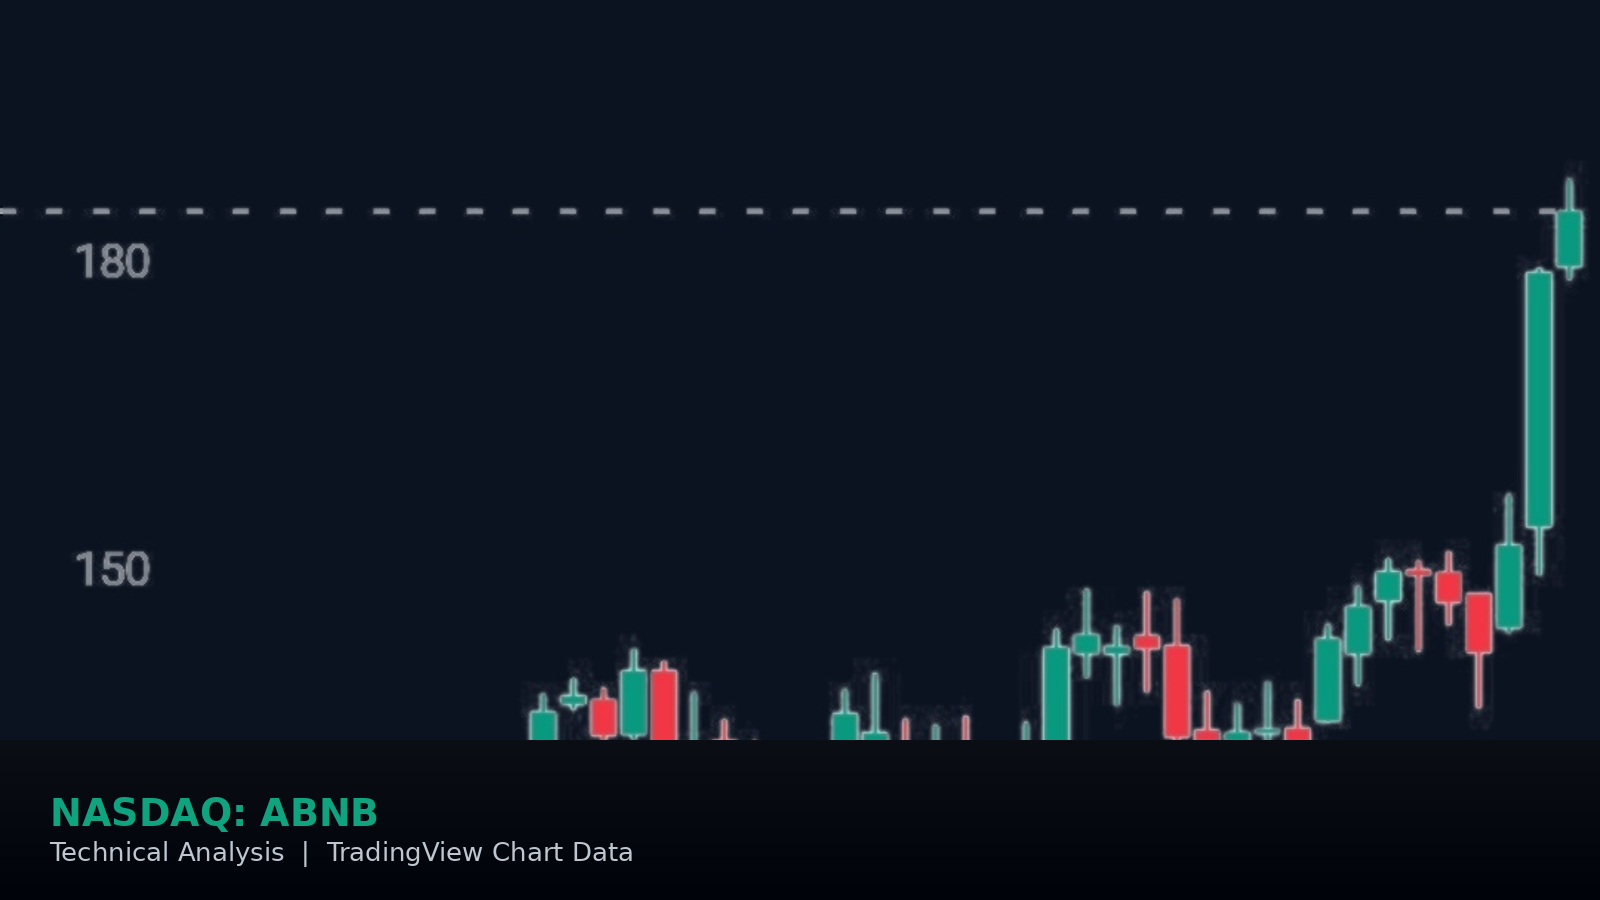
Looking at the one-year candlestick chart, ABNB spent most of the period consolidating in a wide range between roughly $120 and $155, working through several rounded bottoms and local peaks. Then, in the final weeks of the period, the stock broke sharply higher, with one large green candle carrying price from the $150s to above $180 in a matter of sessions. This kind of vertical breakout after a long consolidation often reflects a fundamental catalyst, and in ABNB's case the move coincided with strong earnings momentum and renewed investor enthusiasm around the company's AI-driven platform strategy.
Chart takeaway: the breakout candle that took ABNB from the $150s to above $180 is one of the largest single moves on the entire one-year chart, and the stock has since traded in a tight range just below its highs, a pattern that often precedes either a continuation higher or a consolidation phase before the next move.
ABNB 1-Year Candlestick Chart, Source: TradingView
ABNB Moving Average Analysis: Is the Trend Bullish?
Moving averages smooth out daily price noise and help identify the underlying trend. For ABNB, the picture is overwhelmingly bullish, which is why TradingView's Moving Average summary currently reads "Strong Buy" with 13 Buy signals against just 1 Sell and 1 Neutral reading.
Every standard moving average is comfortably below the current price. The 10-day EMA sits at $173.27 and the 10-day SMA at $170.17, both trailing well behind the stock's recent breakout. The 20-day and 30-day averages (EMA at $163.90 and $158.58, SMA at $158.30 and $154.53) show the same pattern, as does the 50-day pairing (EMA $152.36, SMA $148.42) and the 100-day pairing (EMA $144.78, SMA $141.54).
The 200-day averages, at $138.62 (EMA) and $134.74 (SMA), sit far below the current price, underscoring just how much ground ABNB has covered relative to its longer-term trend. The one outlier on the board is the 9-day Hull Moving Average at $190.05, a fast-reacting indicator that registers a Sell signal simply because it sits slightly above the current price, a reflection of how sharply the stock has pulled back from its intraday highs rather than a broader trend warning.
The wide gap between price and the 200-day moving averages is worth watching. While it confirms a powerful uptrend, it also means the stock is trading well above its historical trend line, which can increase the odds of a mean-reversion pullback even within an otherwise healthy bull trend.
ABNB RSI and MACD: Is ABNB Stock Overbought?
Oscillators help gauge momentum and whether a stock is overextended in either direction. Here, ABNB's readings lean cautious, with the overall Oscillators rating at "Sell" (4 Sell, 5 Neutral, 2 Buy), a signal worth taking seriously after such a sharp advance.
The Relative Strength Index (14) reads 74.99, just above the traditional overbought threshold of 70. This is a meaningful signal: readings above 70 often indicate a stock has moved too far, too fast, and may be due for a cooling-off period or short-term pullback even within a longer-term uptrend. The Commodity Channel Index at 127.10 and Williams Percent Range at -7.84 both register Sell signals for similar reasons, while Momentum (10) at 32.54 also flags as Sell, reflecting how far and fast the recent breakout carried the stock.
Not every reading points to exhaustion. The MACD Level (12,26) at 10.43 registers a firm Buy signal, confirming that the underlying trend remains upward even if short-term momentum is stretched. The Ultimate Oscillator at 73.75 also leans Buy. Stochastic %K (91.10), Average Directional Index (34.61), Awesome Oscillator (29.51), Stochastic RSI Fast (77.53), and Bull Bear Power (31.10) all sit in neutral territory.
Taken together, the oscillator picture suggests ABNB's rally has been powerful but may be entering a phase where some consolidation or a pullback toward the 10-day and 20-day moving averages would be a healthy and fairly normal development, rather than a sign the broader uptrend is over.
ABNB Support and Resistance Levels: Key Pivot Points
Classic pivot point analysis, calculated from the prior trading range, offers a useful framework for identifying where ABNB stock could face buying or selling pressure next. It's worth noting that because ABNB just broke out so sharply, several of these classic pivot levels now sit below the current price and may act more as support on a pullback than as resistance on the way up.
Resistance levels: The classic R1 pivot sits at $160.11, already well below the current price following the recent breakout, with R2 at $168.69 and R3 at $189.47. The R3 level, just above the current price, is arguably the more relevant near-term resistance marker on this table, roughly aligning with the Hull Moving Average Sell signal at $190.05.
Support levels: The central pivot point (P) is calculated at $147.91, a level that would represent a significant pullback from current prices but lines up closely with the 50-day moving averages. Below that, S1 sits at $139.33 and S2 at $127.13, both closer to the stock's pre-breakout trading range and areas where longer-term buyers may look to add on weakness.
For traders watching the chart in real time, the $173–$190 zone is the most immediate area of interest, since it combines the 10-day moving averages, the recent breakout base, and the Hull Moving Average resistance near $190.
ABNB Stock Price Target: What Analysts Forecast
Beyond the technical picture, Wall Street sentiment toward ABNB is more mixed than the strong technical ratings suggest. Based on ratings from 46 analysts issued over the past three months, the consensus rating is "Buy," though the breakdown shows real division: 20 rate it Strong Buy, 4 Buy, 18 Hold, 2 Sell, and 2 Strong Sell.
The average 12-month price target stands at $175.53, which is actually about 4.64% below the current price of $184.06, an unusual situation where the stock's recent rally has outpaced the average analyst target. Estimates from the 36 analysts offering 1-year price forecasts range from a low of $125.00 (-32.09%) to a high of $215.00 (+16.81%), reflecting a notably wide spread of opinion. This divergence between a bullish technical setup and a more cautious average price target is an important nuance: it suggests the market has priced in more optimism than the typical analyst currently supports, at least on a 12-month view.
ABNB Trend Structure and What to Watch Next
Putting the pieces together, ABNB's chart currently reflects a stock in a powerful uptrend that has just completed a sharp, high-volume breakout after a long consolidation phase. Every major moving average confirms the bullish trend, but the oscillators, led by an RSI just above 70, are flagging that the stock may be short-term overbought after such a fast move.
The key technical question is whether ABNB can hold above the $173–$180 zone, roughly where the 10-day moving averages sit, or whether it pulls back further toward the $160s to work off some of the recent momentum before its next move. A hold above the breakout zone with the RSI cooling back toward the 60s would be a constructive sign that the rally has legs. On the other hand, a decisive break back below $170 would suggest the breakout needs more time to consolidate.
It's also worth noting the disconnect between technicals and analyst targets described above. With the average price target sitting below the current price, some of the stock's recent strength may be running ahead of fundamental estimates, at least for now. As with any stock that has posted a sharp, fast breakout, volatility should be expected in both directions, and traders following ABNB technically will want to monitor how price behaves around the 10-day, 20-day, and Hull Moving Average levels in the coming sessions.
Conclusion
Airbnb (ABNB) stock is showing a powerful technical breakout following a long consolidation phase, with every major moving average confirming the new uptrend. That said, an RSI just above the overbought threshold and a Sell-rated oscillator summary suggest the stock may be due for a pause or pullback after such a sharp advance. Layered on top of that, the average analyst price target of $175.53 sits below the current price, a reminder that fundamentals and near-term technical momentum are not fully aligned right now. ABNB remains a stock worth tracking closely, particularly around the $170–$190 zone where near-term support and resistance are converging. As always, technical analysis should be used alongside sound risk management and a clear understanding of your own investment objectives.
Frequently Asked Questions (FAQ)
Is ABNB stock a buy right now based on technical analysis?
TradingView's technical summary currently rates ABNB a "Buy" overall, with Moving Averages at "Strong Buy" but Oscillators at "Sell." The mixed oscillator picture, driven by an overbought RSI, suggests some caution is warranted even within the broader uptrend. Always confirm against current price action and your own risk tolerance before making any decision.
Is ABNB stock overbought after its recent rally?
The RSI at 74.99 sits just above the traditional overbought threshold of 70, suggesting the stock's sharp recent breakout may be due for a pause or pullback in the near term, even though the longer-term trend remains firmly bullish.
What is the key resistance level for ABNB stock?
The most relevant near-term resistance sits near $190.05, based on the 9-day Hull Moving Average, which is the only moving average currently registering a Sell signal. The classic R3 pivot at $189.47 aligns closely with this level.
What is the average analyst price target for ABNB?
The average 12-month analyst price target is $175.53, which is about 4.64% below the current price of $184.06, based on ratings from 46 analysts. This is an unusual case where the stock's technical breakout has outpaced the average fundamental price target.
What is the main support level to watch for ABNB?
The central pivot point at $147.91 represents a deeper support level tied to the 50-day moving averages, while the $170–$173 zone, aligned with the 10-day moving averages, is a more immediate area of support following the recent breakout.
What is the ABNB stock price prediction for the next 12 months?
Based on ratings from 46 analysts, the average 12-month price target for ABNB stock is $175.53, with estimates ranging from $125.00 to $215.00. The consensus rating is Buy, though the wide range of targets reflects real disagreement among analysts about the stock's fair value after its recent surge.
Disclaimer
This article is for informational and educational purposes only and does not constitute investment advice, financial advice, trading advice, or a recommendation to buy, sell, or hold any security. The technical analysis presented is based on publicly available chart data and indicators from TradingView at the time of writing and is subject to change without notice. Stock prices are volatile, and past performance is not indicative of future results. Readers should conduct their own research and consult a licensed financial advisor before making any investment decisions.