Monero price breaks out of bullish structure as crypto market tanks, rally to $500 in sight
Monero’s price has flashed multiple bullish signals that could pave the way for a potential rally to as high as $500 over the coming weeks.
- Monero price is up 10% over the past week.
- Speculation from futures traders has mostly driven its price recently.
- Multiple bullish patterns have been confirmed on the daily chart.
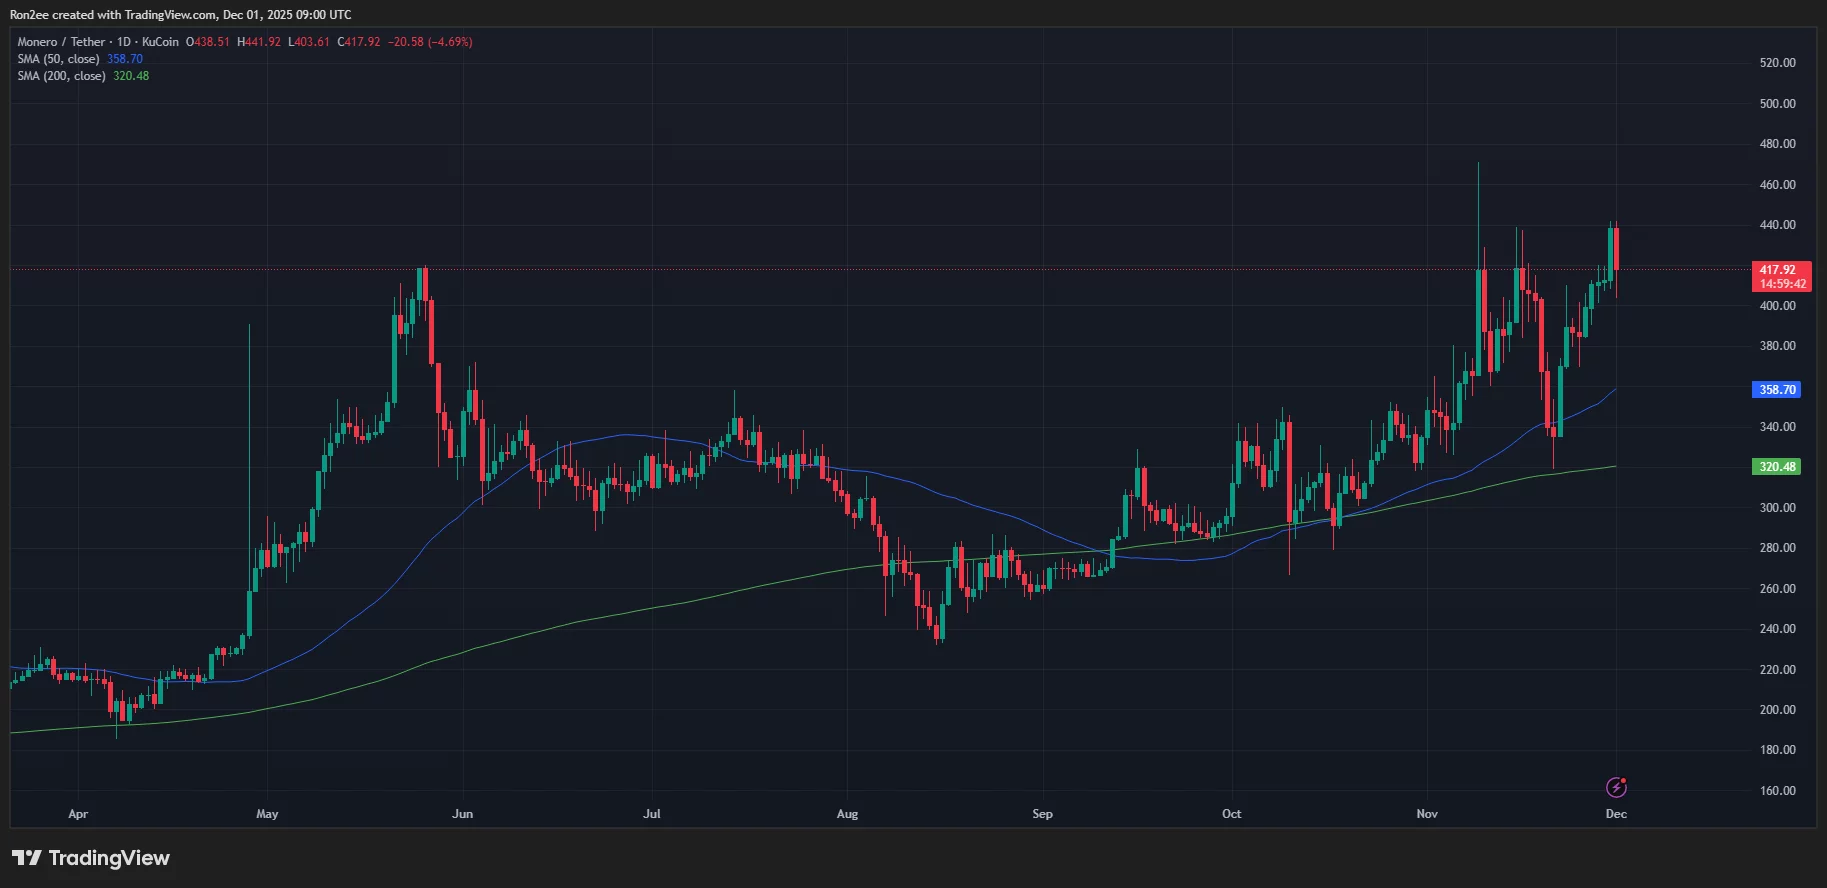
According to data from crypto.news, Monero (XMR) rallied 10% over the past 7 days and has rebounded by 30% from its Nov. 21 low. Trading at $419.2, the largest privacy coin in the market is currently above 115% from its year-to-date. However, the token still remains 22.7% below its all-time high of $542.3 reached nearly 8 years ago.
Monero price rallied amid a broader resurgence of privacy-focused crypto assets such as Zcash (ZEC), Railgun (RAIL), and Dash (DASH) that began in early October. ZEC rallied over 1,600% to a yearly high of $723 in early November, while DASH rose 460% to $145.95 in the same period. However, these cryptocurrencies have crashed since then and are trading much lower than their former highs.
At press time, the majority of leading privacy tokens were still in the red on the weekly timeframe, with Monero standing as the only exception. This suggests that traders are likely rotating their profits from other assets to Monero, triggering its recent gains.
A closer look at derivatives data from CoinGlass reveals that Monero’s latest price move has been largely fueled by speculative activity in the futures market.
Data from CoinGlass shows that Monero futures OI was up 10% in the past 24 hours at $70 million, up from $55 million nearly a week ago. Soaring OI means traders are opening more leveraged positions and could signal heightened speculative interest.
However, traders should keep in mind that a rally led by perpetuals is often considered fragile, especially if there is little support from spot buyers. Such rallies could reverse quickly if traders unwind their positions in large numbers.
Still, if XMR manages to hold its ground amid the current bearish market, traders could see it as a sign of resilience and a relatively safer bet amidst the current downturn.
Monero price analysis
On the daily chart, Monero price has formed a golden cross as the 50-day simple moving average crossed above the 200-day one. Such patterns, when confirmed, have typically led to strong uptrends for many related crypto assets over the weeks or months that followed.
Momentum indicators like the MACD also showed that bulls are still in control of the market. The MACD lines have formed a positive crossover with the signal line and were pointed upwards at the time of writing, suggesting growing bullish momentum.
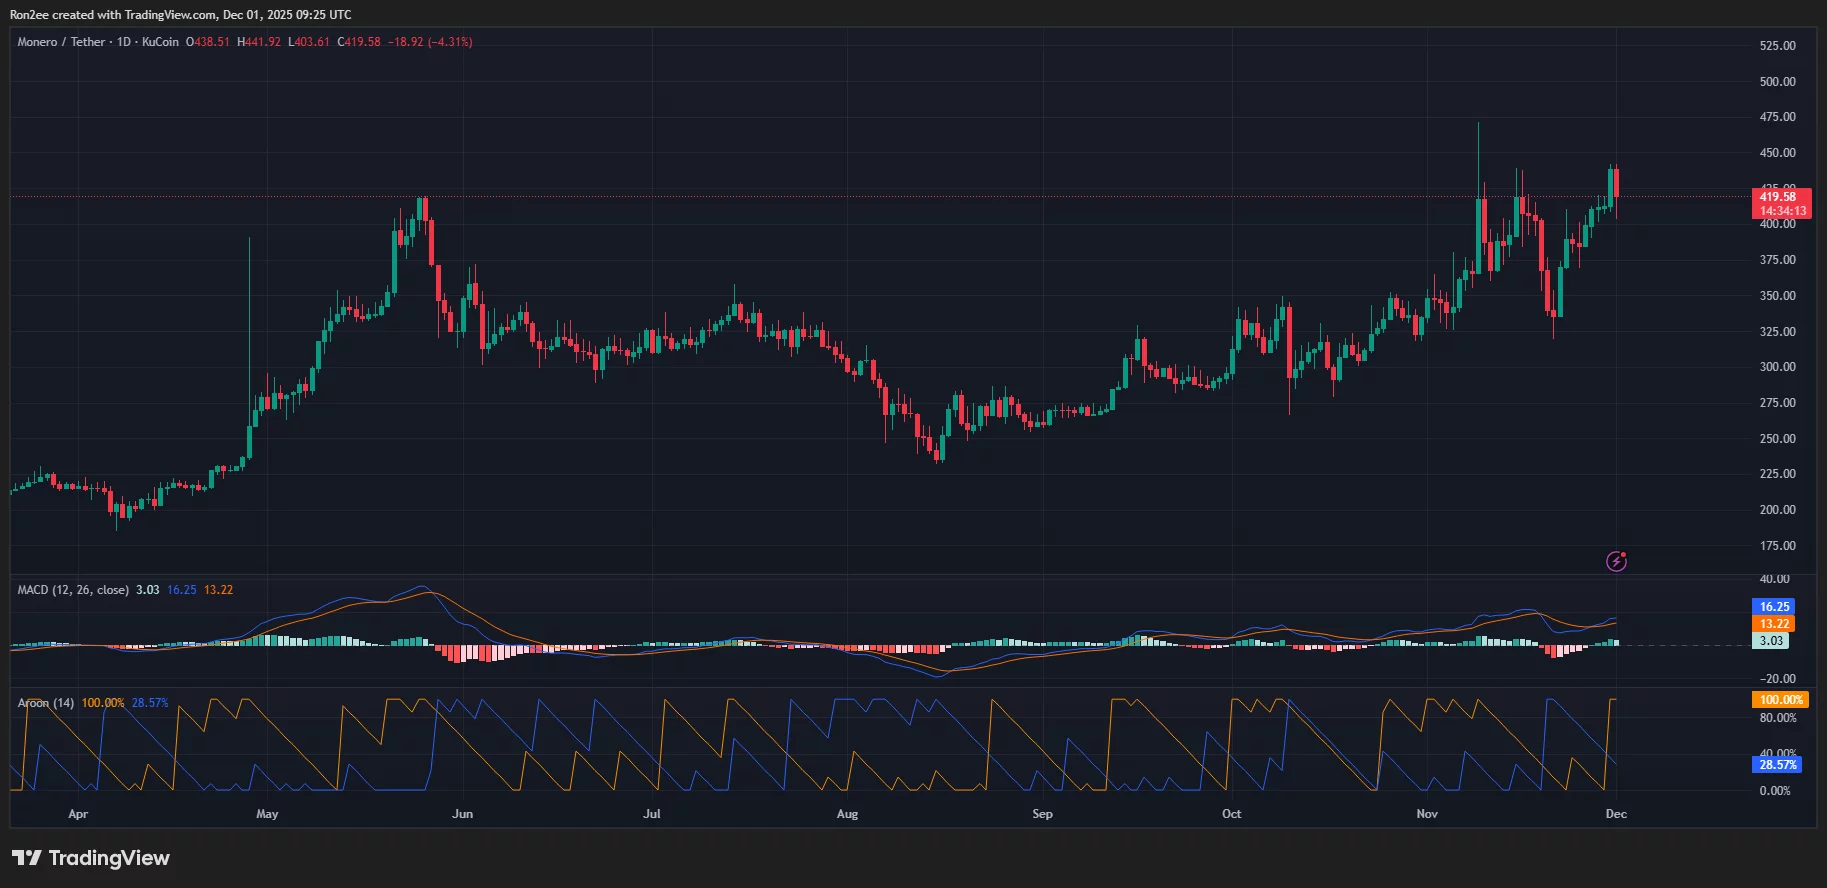
Additionally, the Aroon Up reading stood at 100% while the Aroon Down was at 28.57%, another telltale sign that traders were still favoring the upside with minimal bearish pressure in sight.
As such, Monero could most likely rally to $500, with no immediate resistance zone between the current level and that target. That being said, if the broader weakness across the crypto market continues to deepen, it could likely drag Monero lower as traders rush to lock in profits and reduce exposure to the token.
Disclosure: This article does not represent investment advice. The content and materials featured on this page are for educational purposes only.
You May Also Like

Your Gateway To The Next Promising Altcoin

XRP Moves Sideways Above $2.00