Dogecoin Price Prediction: Can DOGE Price Revisit the $0.70 Zone as Historical Patterns Align With New Analyst Models?
A recently shared long-term analysis highlights exponential wave structures and recurring swing-high patterns, suggesting that Dogecoin may be entering a phase where past cycle behavior begins to align with current market positioning.
According to the chartist, the trendline confluence “indicates a possible 450% upside toward the $0.70–$0.75 range.” However, the author clarified that this is a model-based projection, not a precise forecast, adding that such levels “may represent a potential bull cycle peak rather than a mid-cycle move.”
This interpretation partially aligns with several long-range Dogecoin price prediction models that use logarithmic charts dating back to 2014. While visually compelling, these models rely heavily on past patterns, and analysts caution that similar setups have shown wide error margins during prior crypto cycles.
Current Market Performance and Technical Conditions
As of December 5, 2025, Dogecoin (DOGE) trades near $0.15, retreating from October’s highs around $0.26 amid sector-wide consolidation. The cryptocurrency also marked a yearly low of $0.148 on December 5, underscoring the continued downward pressure.
Dogecoin’s weekly structure suggests a potential $0.70–$0.75 target in the next cycle phase, though whether it marks a cycle top remains uncertain. Source: @Bitcoinsensus via X
Several commonly used technical indicators currently suggest a cooling trend:
-
Moving averages: DOGE is positioned below its 20-day, 50-day, and 200-day moving averages.
-
MACD: The MACD—used to measure trend strength—shows downward momentum.Analysts following the indicator note that a “strong sell” signal reflects deteriorating short-term momentum, though confirmation typically requires volume support and multi-timeframe analysis.
Despite this, some forecasting models anticipate a short-term rebound toward the $0.19 area by the end of December. This reflects a more moderate stance compared with the optimistic tone circulating on social platforms.
Community Sentiment and Analyst Commentary
The same chartist who shared the wave-pattern analysis previously outlined near-term targets of $0.1500 and $0.1522—both of which were reached shortly after publication. The analyst later remarked that “Doge is ready to go,” but this assessment reflects an individual viewpoint rather than consensus analysis.
Feedback on X (formerly Twitter) shows a mix of curiosity and skepticism. Some users highlight increasing alignment between long-term pattern projections and recent price movements, while others emphasize the need for greater liquidity and rotational capital from other altcoins before any meaningful uptrend can develop.
Dogecoin appears poised for further upside momentum, with its mid-cycle target aligning around $1.30 based on the parallel channel structure. Source: Cryptollica on TradingView
Professional research platforms provide more structured forecasts. Finder’s panel of fintech specialists and CoinCodex’s model-driven outlook place the Dogecoin price prediction 2025 range between $0.33 and $0.65. These projections acknowledge potential upside but underscore that a move toward the $0.70 region would require supportive macro conditions.
Dogecoin also maintains approximately 70% correlation with Bitcoin, according to several market data providers. Analysts note that such a high correlation means DOGE rarely stages independent breakouts without broader crypto-market strength.
Institutional Flow and Real-World Adoption
Despite recent price weakness, Dogecoin-related developments continue to emerge. Grayscale’s DOGE ETF, launched on NYSE Arca earlier this year, has attracted early-stage institutional interest. While current inflows remain modest, ETF specialists say its long-term impact will depend on sustained market demand and broader sentiment toward meme-linked digital assets.
Dogecoin’s 2-month chart signals the early stages of a major volatility phase, hinting at the potential start of a larger cyclical upswing. Source: @TATrader_Alan via X
On the adoption front, Buenos Aires recently began allowing residents to pay certain municipal taxes using Dogecoin, facilitated through licensed crypto payment processors. A Latin American payments consultant explained that “municipal-level experimentation doesn’t transform Dogecoin overnight, but it signals a shift toward broader utility and growing comfort with cryptocurrency transactions.”
Such developments help diversify Dogecoin’s narrative beyond speculative trading, though their near-term impact on price remains limited.
Historical Context and Long-Term Considerations
Dogecoin’s multi-year performance illustrates both high volatility and significant historical returns. A hypothetical $1,000 investment made five years ago would now exceed $60,000—despite DOGE trading well below its all-time high of $0.74 set in May 2021. This long-term resilience supports ongoing discussions around future milestones, including whether Will Doge ever reaches $1.
Crypto strategists generally advise caution. A digital asset researcher highlighted that Dogecoin has achieved outsized gains during periods of viral attention, but repeating a 2021-style rally would require not only retail enthusiasm but also a strong macro environment and substantial capital inflow.
Key risks include:
-
Unlimited supply model: DOGE has no hard cap, which may dilute long-term value if demand does not scale proportionally.
-
Sensitivity to sentiment: Historically, Dogecoin has reacted sharply to social-media trends and public commentary, making it more volatile than many large-cap assets.
-
Uncertainty of ETF impacts: Early institutional products do not guarantee sustained inflows.
-
Pattern-based forecast limitations: Technical models that rely on historic similarities often struggle during regime shifts or unexpected macro events.
Even so, analysts acknowledge that Dogecoin’s community strength, recurring waves of mainstream attention, and periodic surges in trading volume can contribute to episodes of accelerated price movement.
Outlook: Can Dogecoin Approach the $0.70 Zone Again?
Forecasts diverge widely, but many technical models circulating this week note similarities between current chart structures and those seen during earlier growth phases. These comparisons, while informative, remain speculative and should be treated as scenario analysis rather than directional predictions.
Dogecoin was trading at around $0.15, down 3.29% in the last 24 hours. Source: Brave New Coin
If broader market conditions stabilize, particularly if Bitcoin resumes a sustained upward trend, analysts agree that Dogecoin could revisit higher resistance areas over time. However, reaching the $0.70 zone would require favorable liquidity, improved sentiment, and broader participation from institutional and retail investors.
You May Also Like

Your Gateway To The Next Promising Altcoin

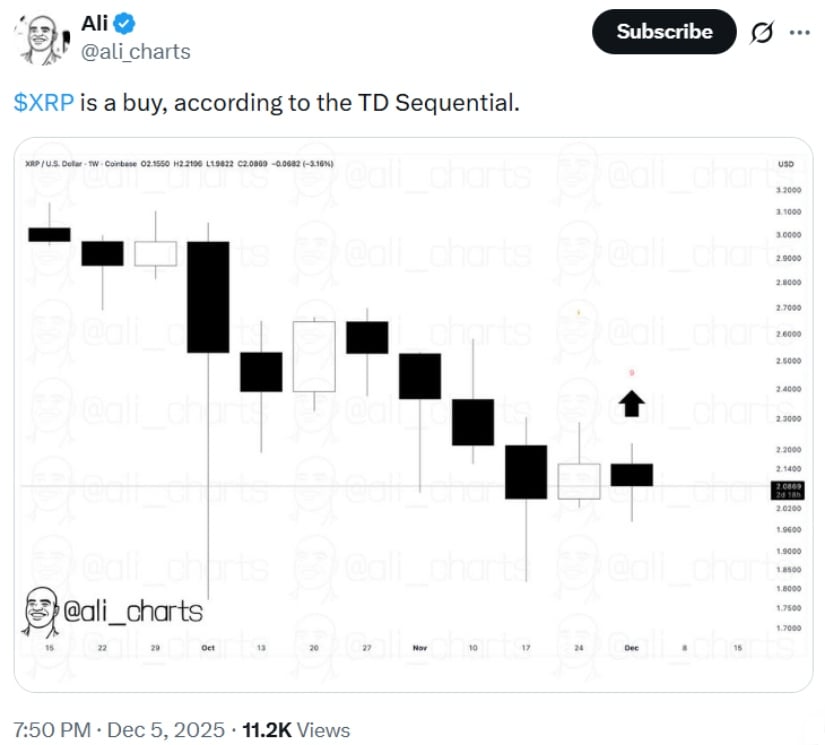
XRP Moves Sideways Above $2.00