Stellar Leads Developer Growth As XLM Ecosystem Surges To 4,400 Builders
Stellar developer count rose 86% YoY to 4,400+ builders in Q1, while XLM trades near $0.1518 below key resistance.
Stellar posted fast developer growth across the XLM ecosystem, Electric Capital data showed.
The network reached more than 4,400 builders in Q1, while developer count rose 86% year over year.
The report also showed 171% growth over three years, placing Stellar among the fastest growing blockchain developer ecosystems.
Stellar Developer Growth Reaches 4,400 Builders
Stellar has recorded strong developer activity, according to Electric Capital data shared across the market.
The XLM ecosystem reached more than 4,400 builders during the first quarter. The data also showed 86% year-on-year growth in developer count.
Over three years, the Stellar ecosystem expanded by 171%, which points to steady builder interest.
A market analyst said, “Developer count on Stellar grew 86% YoY to 4,400+ builders in Q1 alone.” The post also called Stellar the fastest growing developer ecosystem.
Developer growth is often watched by crypto markets because it can show network activity. More builders can support new tools, apps, and blockchain services.
Stellar has focused on payments, asset transfer, and tokenized value. These areas remain important for developers building financial products on public networks.
XLM Price Trades Below Key Fibonacci Level
Despite the growth in builders, XLM price action remains weak on the daily chart. XLM was trading near $0.1518, down about 1.79% on the chart.
The token remains below the key Fibonacci base at $0.2799. That level formed the lower part of the measured Fibonacci range.
The chart range runs from $0.2799 to $0.4747. XLM has broken below the 1.0 Fibonacci level, which had acted as support.
This move has kept sellers in control on the higher time frame. A move back above $0.2799 would be needed for stronger buyer control.
The next major Fibonacci extension is near $0.1596. XLM is trading close to that area, so traders may watch for a reaction.
If XLM fails to hold $0.1500 to $0.1596, lower support zones may return to focus. A recovery may first need a move above $0.18 and $0.20.
Read Also:
Resistance Levels Remain Above Current Price
The first major resistance for XLM sits near $0.2799. That former support area may now act as resistance during any rebound.
Above that level, the next resistance zones are $0.3216, $0.3543, and $0.3773. These zones match the 0.786, 0.618, and 0.5 Fibonacci levels.
A stronger recovery would need XLM to reclaim $0.4003 and $0.4287. These areas may attract sellers because prices have been rejected near them before.
The upper range high remains near $0.4747. XLM would need to clear several resistance levels before that area returns to focus.
Momentum readings also show a cautious setup. The RSI stood near 38.93, while the signal line was around 46.69.
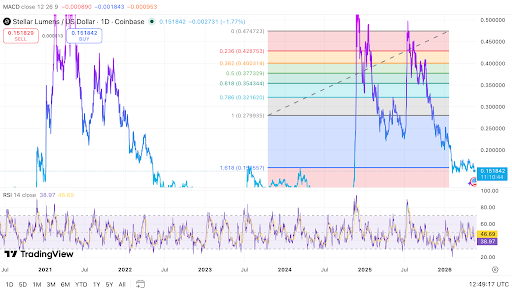 XLM trades below major Fibonacci levels as momentum weakens. Source: TradingView
The RSI remains below 50, which shows weak momentum. It is not deeply oversold, so the price may still face pressure.
The MACD also remains slightly negative. Readings near -0.000893, -0.001846, and -0.000953 show soft bearish momentum.
Stellar’s developer growth gives the XLM ecosystem a strong network story. However, the XLM daily chart still shows pressure below $0.2799.
The post Stellar Leads Developer Growth As XLM Ecosystem Surges To 4,400 Builders appeared first on Live Bitcoin News.


You May Also Like

Bitcoin treasury sell-off accelerates as Riot, Bhutan, and public companies exit positions

Will Michael Saylor and Strategy Sell Bitcoin Soon? New Claims and Information Have Emerged