

Ondo (ONDO) Price Prediction 2025, 2026-2030
- Bullish ONDO price prediction for 2025 is $0.5536 to $0.7066.
- Ondo (ONDO) price might reach $5 soon.
- Bearish ONDO price prediction for 2025 is $0.3673.
In this Ondo (ONDO) price prediction 2025, 2026-2030, we will analyze the price patterns of ONDO by using accurate trader-friendly technical analysis indicators and predict the future movement of the cryptocurrency.
|
TABLE OF CONTENTS
|
|
INTRODUCTION
|
|
|
ONDO (ONDO) PRICE PREDICTION 2025
|
|
| ONDO (ONDO) PRICE PREDICTION 2026, 2027-2030 |
| CONCLUSION |
| FAQ |
Ondo (ONDO) Current Market Status
| Current Price | $0.4834 |
| 24 – Hour Price Change | 2.28% Down |
| 24 – Hour Trading Volume | $117.03M |
| Market Cap | $1.52B |
| Circulating Supply | 3.15B ONDO |
| All – Time High | $2.14 (On Dec 16, 2024) |
| All – Time Low | $0.08355 (On Jan 18, 2024) |
What is Ondo (ONDO)
| TICKER | ONDO |
| BLOCKCHAIN | Ethereum |
| CATEGORY | Decentralized Finance |
| LAUNCHED ON | March 2024 |
| UTILITIES | Governance, Fast Transactions, gas fees & rewards |
Ondo is a blockchain-based cryptocurrency network. Ondo provides an ONDO a native cryptocurrency that operates within the decentralized finance (DeFi) space, offering tokenized access to tangible assets. The platform enables investors to engage with institutional-quality securities, particularly those rooted in the U.S. market. As of now, Ondo has a total supply of 10 billion tokens, with a circulating supply of approximately 1.4 billion tokens. It aims to bridge the gap between traditional finance and DeFi by providing opportunities to invest in real-world assets through blockchain technology.
Ondo 24H Technicals
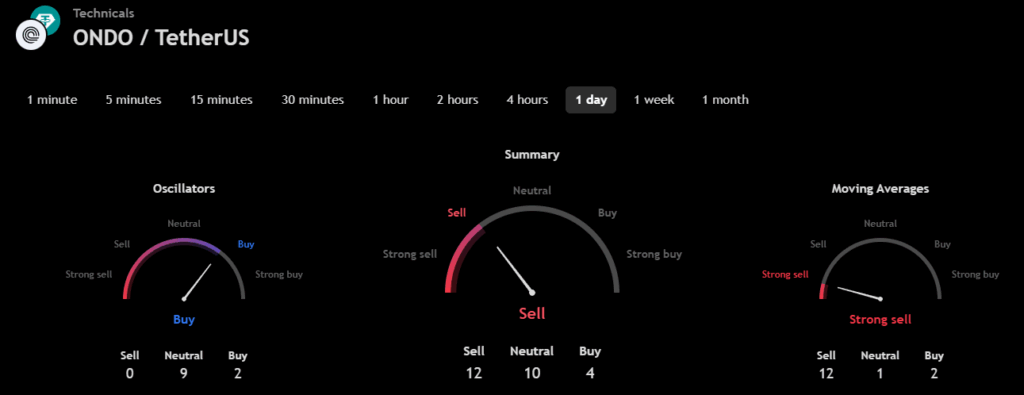 (Source: TradingView)
Ondo (ONDO) Price Prediction 2025
Ondo (ONDO) ranks 47th on CoinMarketCap in terms of its market capitalization. The overview of the Ondo price prediction for 2025 is explained below with a daily time frame.
In the above chart, Ondo (ONDO) laid out a Horizontal Channel pattern. A horizontal channel or sideways trend has the appearance of a rectangle pattern. It consists of at least four contract points. This is because it needs at least two lows to connect, as well as two highs. Horizontal channels provide a clear and systematic way to trade by providing buy and sell points.
The longer the horizontal channel, the stronger the exit movement will be. There is frequently a price on the channel after exit. The exit often occurs at the fourth contact point on one of the horizontal channel’s lines.
At the time of analysis, the price of Ondo (ONDO) was recorded at $0.4834. If the pattern trend continues, then the price of ONDO might reach the resistance level of $0.4886, $0.5344 and $0.6413. If the trend reverses, then the price of ONDO may fall to the support level of $0.4453.
Ondo (ONDO) Resistance and Support Levels
The chart given below elucidates the possible resistance and support levels of Ondo (ONDO) in 2025.
From the above chart, we can analyze and identify the following as resistance and support levels of Ondo (ONDO) for 2025.
| Resistance Level 1 | $0.5536 |
| Resistance Level 2 | $0.7066 |
| Support Level 1 | $0.4426 |
| Support Level 2 | $0.3673 |
ONDO Resistance & Support Levels
Ondo (ONDO) Price Prediction 2025 — RVOL, MA, and RSI
The technical analysis indicators such as Relative Volume (RVOL), Moving Average (MA), and Relative Strength Index (RSI) of Ondo (ONDO) are shown in the chart below.
From the readings on the chart above, we can make the following inferences regarding the current Ondo (ONDO) market in 2025.
| INDICATOR | PURPOSE | READING | INFERENCE |
| 50-Day Moving Average (50MA) | Nature of the current trend by comparing the average price over 50 days | 50 MA = $0.5894Price = $0.4781(50MA > Price) | Bullish/Uptrend |
| Relative Strength Index (RSI) | Magnitude of price change;Analyzing oversold & overbought conditions | 40.9760 <30 = Oversold 50-70 = Neutral>70 = Overbought | Nearly Oversold |
| Relative Volume (RVOL) | Asset’s trading volume in relation to its recent average volumes | Below cutoff line | Weak volume |
Ondo (ONDO) Price Prediction 2025 — ADX, RVI
In the below chart, we analyze the strength and volatility of Ondo (ONDO) using the following technical analysis indicators — Average Directional Index (ADX) and Relative Volatility Index (RVI).
From the readings on the chart above, we can make the following inferences regarding the price momentum of Ondo (ONDO).
| INDICATOR | PURPOSE | READING | INFERENCE |
| Average Directional Index (ADX) | Strength of the trend momentum | 18.9051 | Weak Trend |
| Relative Volatility Index (RVI) | Volatility over a specific period | 38.12 <50 = Low >50 = High | Low volatility |
Comparison of ONDO with BTC, ETH
Let us now compare the price movements of Ondo (ONDO) with those of Bitcoin (BTC), and Ethereum (ETH).
From the above chart, we can interpret that the price action of ONDO is similar to that of BTC and ETH. That is, when the price of BTC and ETH increases or decreases, the price of ONDO also increases or decreases, respectively.
Ondo (ONDO) Price Prediction 2026, 2027 – 2030
With the help of the aforementioned technical analysis indicators and trend patterns, let us predict the price of Ondo (ONDO) between 2026, 2027, 2028, 2029, and 2030.
| Year | Bullish Price | Bearish Price |
| Ondo (ONDO) Price Prediction 2026 | $5.6 | $0.2 |
| Ondo (ONDO) Price Prediction 2027 | $7.3 | $0.1 |
| Ondo (ONDO) Price Prediction 2028 | $7.6 | $0.09 |
| Ondo (ONDO) Price Prediction 2029 | $8.2 | $0.08 |
| Ondo (ONDO) Price Prediction 2030 | $8.9 | $0.07 |
Conclusion
If Ondo (ONDO) establishes itself as a good investment in 2025, this year would be favorable to the cryptocurrency. In conclusion, the bullish Ondo (ONDO) price prediction for 2025 is $0.7066. Comparatively, if unfavorable sentiment is triggered, the bearish Ondo (ONDO) price prediction for 2025 is $0.3673.
If the market momentum and investors’ sentiment positively elevate, then Ondo (ONDO) might hit $5. Furthermore, with future upgrades and advancements in the Ondo ecosystem, ONDO might surpass its current all-time high (ATH) of $2.14 and mark its new ATH.
FAQ
1. What is Ondo (ONDO)?
Ondo is a blockchain-based cryptocurrency network. Ondo (ONDO) is a cryptocurrency that operates within the decentralized finance (DeFi) space, offering tokenized access to tangible assets.
2. Where can you purchase Ondo (ONDO)?
Ondo (ONDO) has been listed on many crypto exchanges, which include KuCoin, Gate.io, Bybit, Coinbase, Crypto.com, Coinone, and Indodax.
3. Will Ondo (ONDO) reach a new ATH soon?
With the ongoing developments and upgrades within the Ondo platform, ONDO has a high possibility of reaching its ATH soon.
4. What is the current all-time high (ATH) of Ondo (ONDO)?
On Dec 16, 2024, Ondo (ONDO) reached its new all-time high (ATH) of $2.14.
5. What is the lowest price of Ondo (ONDO)?
According to CoinMarketCap, ONDO hit its all-time low (ATL) of $0.08355 on January 18, 2024.
6. Will Ondo (ONDO) reach $5?
Ondo (ONDO) is one of the active cryptos that continues to maintain its bullish state. Eventually, if this bullish trend continues then Ondo (ONDO) will hit $5 soon.
7. What will be Ondo (ONDO) price by 2026?
Ondo (ONDO) price is expected to reach $5.6 by 2026.
8. What will be Ondo (ONDO) price by 2027?
Ondo (ONDO) price is expected to reach $7.3 by 2027.
9. What will be Ondo (ONDO) price by 2028?
Ondo (ONDO) price is expected to reach $7.6 by 2028.
10. What will be Ondo (ONDO) price by 2029?
Ondo (ONDO) price is expected to reach $8.2 by 2029.
Top Crypto Predictions
Vine Coin (VINE) Price Prediction
Popcat (SOL) POPCAT Price Prediction
Sonic (prev. FTM) (S) Price Prediction
Disclaimer: The opinion expressed in this article is solely the author’s. It does not represent any investment advice. TheNewsCrypto team encourages all to do their own research before investing.
You May Also Like

Solana Price Stalls as Validator and Address Counts Collapse
Radar Detector Apps: Tech that Takes the Boredom Out of Road Trips
