

Bitcoin Price Prediction: BTC Jumps 2.7% Ahead Of Fed Rate Cut Decision Today
The Bitcoin price jumped 2.7% in the past 24 hours to trade at $92,880 as of 2:32 a.m. EST on trading volume that rose 17% to $52.7 billion.
The BTC price pump comes as the crypto space expects the Federal Reserve Bank to cut interest rates by 25 basis points today following its two-day meeting.
Markets are pricing in an 87.6% likelihood of a rate cut, according to the CME Group FedWatch tool.
But investors also anticipate that policymakers will signal that further easing is not guaranteed, given still-elevated inflation levels and internal divisions within the Federal Open Market Committee (FOMC).
Comments from Fed Chair Jerome Powell will thus be key in shaping market sentiment.
A hawkish tone from Powell could strengthen the US dollar and push Treasury yields higher, reducing appetite for non-yielding risk assets like BTC.
With Bitcoin’s price surging, US spot BTC ETFs (exchange-traded funds) recorded inflows of $151.9 million on Tuesday, according to Coinglass.
Bitcoin Price Set For A Sustained Breakout
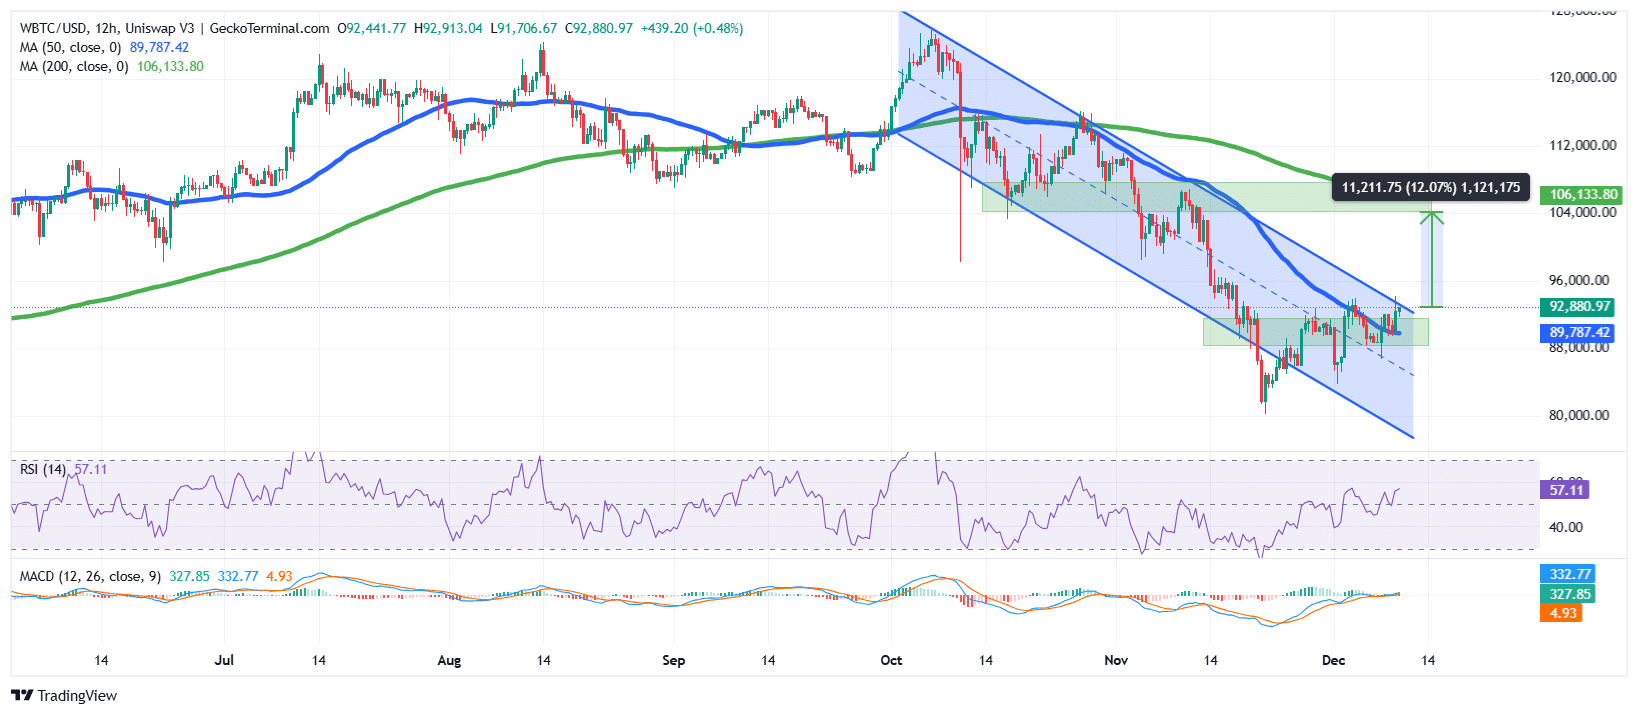
After hitting a local high of around $126,000 in October, the BTC price has been on a sustained downtrend within a falling channel pattern, which is a signal that bears have been in control.
The sustained downtrend allowed the bears to push Bitcoin below the lower boundary around $82,000 before it recovered and consolidated within the $88,000 zone.
The $88,000 zone has kept BTC trading just below the $94,000 area, which now acts as resistance if Bitcoin were to sustain an uptrend.
BTC is now trading within the upper boundary of the falling channel and is poised for a breakout, as it has crossed above the 50-day Simple Moving Average (SMA) at $89,787. The 200-day SMA still trades above the Bitcoin price on the 12-hour chart, placing it as the long-term resistance area ($106,133).
Meanwhile, buyers may be regaining some footing, as the Relative Strength Index (RSI) has recovered above the 50-midline level.
Moreover, the Moving Average Convergence Divergence (MACD) indicator is also showing signs of a recovery, with the blue MACD line crossing above the orange signal line. The green bars on the histogram are also surging above the zero line, which could indicate that BTC’s price may be regaining momentum.
 BTC/USD Chart Analysis Source: GeckoTerminal
BTC Price Set To Surge over 12%
According to the BTC/USD chart analysis, the BTC price could be gearing up for a recovery above the falling channel.
If the current uptrend continues, Bitcoin’s price could surge 12% to target the $104,119 resistance area.
However, on the downside, if BTC fails to breach the $94,000 barrier again, the next support level could be at $84,500, coinciding with the lower boundary of the falling channel.
According to Ali Martinez, a prominent crypto analyst on X, FOMC meeting happens frequently trigger Bitcoin corrections.
Related News:
You May Also Like

a16z Crypto Expands into Asia with New Office in Seoul, South Korea

Academic Publishing and Fairness: A Game-Theoretic Model of Peer-Review Bias
