Dogecoin Price Setup Turns Bullish as Daily Divergence Appears
Dogecoin trades near $0.1117 as hidden bullish divergence forms, with traders watching $0.13–$0.15 after consolidation.
Dogecoin traded near $0.1117 on the daily chart as buyers tried to defend short-term support.
The chart now shows a hidden bullish divergence after a recent bearish setup. Traders are watching whether DOGE can build momentum toward the $0.13 to $0.15 range.
Dogecoin Forms Hidden Bullish Divergence
Dogecoin recently formed a regular bearish divergence on the daily chart. Price moved higher, while momentum failed to follow. After that signal, DOGE moved lower.
A market analyst said, “Dogecoin formed a regular bearish divergence, and yes, the price came down.”
The same trader added that DOGE has now formed a hidden bullish divergence. This has shifted attention back to a possible rebound.
Hidden bullish divergence can appear during a pullback within a wider recovery phase.
It forms when price holds a higher low, while momentum makes a lower low. Traders often use this signal to track possible trend continuation.
This setup does not confirm a breakout by itself. However, it gives buyers a fresh technical signal to follow. DOGE still needs stronger price action above nearby resistance.
DOGE Consolidates After Liquidity Sweep
Dogecoin remains in a long consolidation phase on the daily chart. This range developed after a major liquidity sweep and a broad downtrend.
As a result, price has stayed below major resistance levels. Analyst BitGuru said DOGE is still being watched closely.
The chart shows a base forming after a long decline. This base may become important if momentum continues to improve.
If buying pressure holds, DOGE could move toward $0.13 to $0.15. That range sits above the current price and near key resistance. A move into that area would need steady daily closes.
However, DOGE first needs to clear the $0.120 to $0.125 area. A move above that zone could bring $0.1378 into focus. The $0.1378 to $0.1400 range remains the main breakout area.
Read Also:
DOGE Technical Analysis Shows Key Levels
DOGE is trading below the first major Fibonacci level near $0.1378. This level has become an important resistance zone. A daily close above it would improve the current chart structure.
Immediate support is near $0.105 to $0.110. This area has helped DOGE stabilize during the latest rebound. A break below $0.10 would weaken the bullish setup.
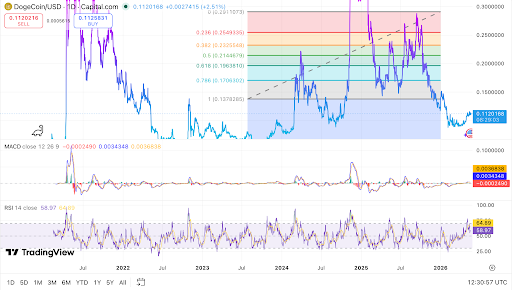 DOGE daily chart shows bullish divergence after extended consolidation. Source: TradingView
The MACD is showing early signs of stabilization. The MACD line is near 0.00341, while the signal line is near 0.00368.
The histogram remains slightly negative, so momentum is not yet strong. The RSI is near 58.6, with its moving average around 64.9.
This places DOGE in a neutral to mildly bullish range. For now, a close above $0.14 remains the key level for confirmation.
The post Dogecoin Price Setup Turns Bullish as Daily Divergence Appears appeared first on Live Bitcoin News.


You May Also Like

CLARITY Act Passes Senate Banking Committee: What Does This Mean for Crypto?

Exclusive interview with Smokey The Bera, co-founder of Berachain: How the innovative PoL public chain solves the liquidity problem and may be launched in a few months