XRP has already cleared most major exchange lows, yet several deeper liquidity levels remain untouched. According to crypto analyst EGRAG CRYPTO, the current setupXRP has already cleared most major exchange lows, yet several deeper liquidity levels remain untouched. According to crypto analyst EGRAG CRYPTO, the current setup

XRP Nears Final Liquidity Zone as $0.75 Level Comes Into Focus

2026/02/15 09:44
2 min read

XRP has already cleared most major exchange lows, yet several deeper liquidity levels remain untouched.

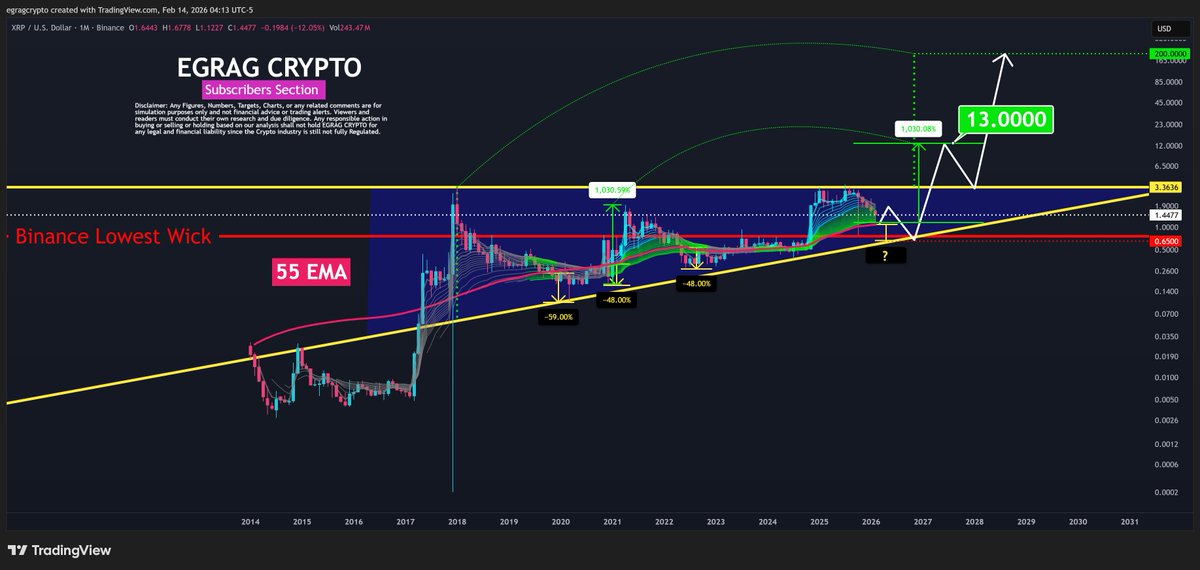
According to crypto analyst EGRAG CRYPTO, the current setup reflects structured liquidity engineering rather than random volatility.

The remaining unswept levels sit below current price action, keeping the downside map technically incomplete.

Most Exchange Lows Have Already Been Taken

Recent price action has swept a wide range of historical exchange lows. Levels at $2.26 and $2.17 on Poloniex, $2.10 on Gemini, $1.77 on Coinbase, $1.58 on Bitstamp, $1.37 on composite charts, and $1.25 on Binance have all been taken.

Source: https://x.com/egragcrypto/status/2022600110094393674

However, three notable levels remain intact: $1.08 on KuCoin (XRP/USDT), $1.00 on Bitfinex (XRP/USD), and $0.77 on Binance perpetual markets. Binance printed the most aggressive wick during the recent decline, signaling derivatives-driven pressure.

From a structural perspective, unfinished liquidity zones often attract further testing before stabilization occurs.

Historical Mean Reversion Projects Deeper Sweep

Layered onto the wick map is historical cycle symmetry. Prior Super Guppy corrections in XRP measured approximately 50% in one cycle and 40% in another, averaging near 45%.

Applying that historical drawdown range projects a potential final sweep into the $0.75–$0.65 band. This zone aligns with macro green uptrend support while preserving the validity of the broader ascending triangle formation.

If price were to reach this range and hold, the long-term structural pattern would remain intact.

Two Structural Paths From Here

The framework suggests two potential outcomes. One path involves a rapid liquidity sweep followed by a violent reclaim, as sharp reversals often emerge when sentiment reaches exhaustion. The alternative path involves a slower continuation lower, gradually tagging the $0.75–$0.65 region before reversal conditions develop.

In both cases, the analysis centers on structure rather than emotion. The key variable is whether remaining exchange lows are completed and whether macro support holds upon contact.

Equities Flash Record Risk Appetite as Bitcoin Awaits U.S. Demand Confirmation

Conclusion

XRP’s chart now reflects a partially completed liquidity cycle. Most major exchange lows have been swept, but the final layers near $1.08, $1.00, and $0.77 remain open. Historical correction symmetry points toward $0.75–$0.65 as a potential confluence zone.

Until those levels are resolved or decisively invalidated, XRP remains in a liquidity-driven phase where structure dictates the map more than short-term sentiment.

The post XRP Nears Final Liquidity Zone as $0.75 Level Comes Into Focus appeared first on ETHNews.

Market Opportunity
XRP Logo
XRP Price(XRP)
$1.6115
$1.6115$1.6115
+9.70%
USD
XRP (XRP) Live Price Chart
Disclaimer: The articles reposted on this site are sourced from public platforms and are provided for informational purposes only. They do not necessarily reflect the views of MEXC. All rights remain with the original authors. If you believe any content infringes on third-party rights, please contact [email protected] for removal. MEXC makes no guarantees regarding the accuracy, completeness, or timeliness of the content and is not responsible for any actions taken based on the information provided. The content does not constitute financial, legal, or other professional advice, nor should it be considered a recommendation or endorsement by MEXC.

You May Also Like

Reboost Plans Reverse Takeover of Pyratzlabs to Build Profitable Blockchain Group

Reboost Plans Reverse Takeover of Pyratzlabs to Build Profitable Blockchain Group

Reboost Blockchain Corp. (Euronext: MLCOT) has entered into a memorandum of understanding to acquire full ownership of Pyratzlabs through a share-based reverse
Share
CoinTrust2026/02/15 14:55
GBP/USD slips as US–China tensions cool, traders eye BoE speakers

GBP/USD slips as US–China tensions cool, traders eye BoE speakers

The post GBP/USD slips as US–China tensions cool, traders eye BoE speakers appeared on BitcoinEthereumNews.com. The Pound Sterling (GBP) slides on Monday during the North American session, down 0.18% as tensions between the US and China ease, following last Friday’s escalation, which prompted investors to buy safety assets. At the time of writing, GBP/USD trades at 1.3325 after hitting a daily high of 1.3366. Sterling eases amid calmer trade rhetoric and cautious mood ahead of key UK economic releases Last week, US President Trump threatened to impose 100% duties on China’s goods as retaliation for China’s rare earth metals export controls. Nevertheless, Trump posted on Sunday on Truth Social, “Don’t worry about China, it will all be fine!” Earlier, the Treasury Secretary Scott Bessent said that he still expects Trump to meet Chinese President Xi Jinping at the Asia-Pacific Economic Cooperation summit in South Korea later this month. Aside from this, the lack of economic data in the US keeps traders entertained with US politics, the government shutdown and Federal Reserve (Fed) officials crossing the wires. In the UK, investors remain focused on the release of the Autumn budget. However, the docket will feature jobs data and Gross Domestic Product (GDP) figures in the three months to August. Bank of England (BoE) policymakers will speak this week, with six of the nine members of the Monetary Policy Committee (MPC) hitting the wires. Money markets are expecting the BoE to hold rates unchanged, pricing in the next adjustment until March 2026, as inflation is double the bank’s target. GBP/USD Price Forecast: Technical outlook The technical picture shows GBP/USD is trading neutral to slightly tilted to the downside, as price action remains below the 20, 50 and 100-day SMAs, an indication that in the short and medium term, sellers are in charge. Additionally, the Relative Strength Index (RSI) is bearish, trending downward, a sign that further downside…
Share
BitcoinEthereumNews2025/10/14 00:11
SOL Price Prediction: Targets $100 Breakout by March 2026

SOL Price Prediction: Targets $100 Breakout by March 2026

Solana trades at $90.09 with technical indicators pointing to potential $100 breakout. RSI neutral at 39.82 suggests room for upward momentum in coming weeks. (
Share
BlockChain News2026/02/15 15:35