

What are Schiff Pitchforks?
Components of Schiff Pitchforks
How to Draw Schiff Pitchforks on MEXC
Actualités tendance
Voir plus
Fire Kirin XYZ 8580 : Guide d'accès et questions courantes
Cryptsy Cryptsy - Meilleurs Casinos Sweepstakes & Jeux de Tables de Poissons — Légal dans les 50 États Un guide pratique sur Fire Kirin XYZ 8580, incluant ce que ce portail de style
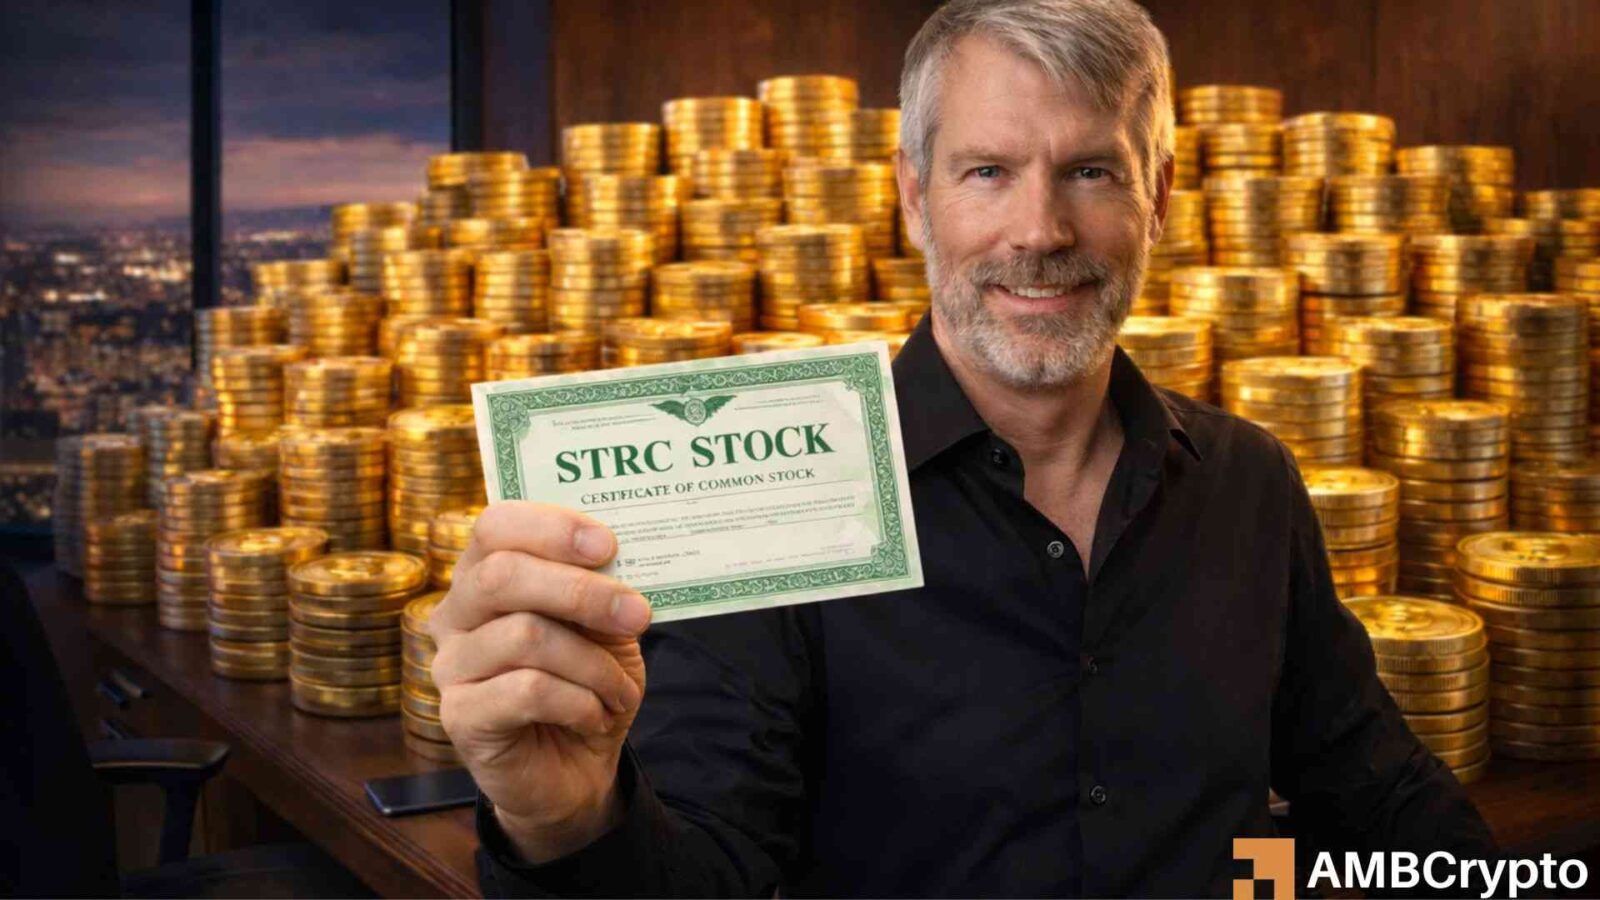
Dans la dernière manœuvre de Saylor : Réorganiser STRC pour améliorer la demande et resserrer l'offre de Bitcoin
L'article Inside Saylor's latest move: Revamp STRC to improve demand and tighten Bitcoin supply est paru sur BitcoinEthereumNews.com. Strategy, la plus grande au monde


Articles connexes
Voir plus
Maîtrisez les tendances du marché grâce aux indicateurs de trading crypto : le guide complet
Dans le trading de cryptomonnaies, l'analyse des indicateurs techniques désigne une méthode quantitative qui utilise des formules mathématiques et statistiques pour évaluer les tendances du marché. En

Qu'est-ce que l'indicateur stochastique (KDJ) ?
L'indicateur stochastique (KDJ) est un outil d'analyse technique qui examine les tendances des prix afin d'évaluer la force du marché et d'identifier les conditions de surachat et de survente, aidant

Qu'est-ce que le SAR parabolique ?
Le SAR (Stop and Reverse) parabolique est un outil d'analyse technique largement utilisé pour identifier la direction des tendances de prix et repérer les points potentiels de retournement. Cet indica

Qu'est-ce qu'un altcoin ? Top 10 des altcoins à connaître en 2026 | Guide du débutant au-delà du Bitcoin
Imaginez un monde où le Bitcoin n'est que le début de la monnaie numérique. C'est exactement ce qui s'est passé dans l'univers des cryptomonnaies. Si le Bitcoin reste le pionnier et la plus grande cry
