

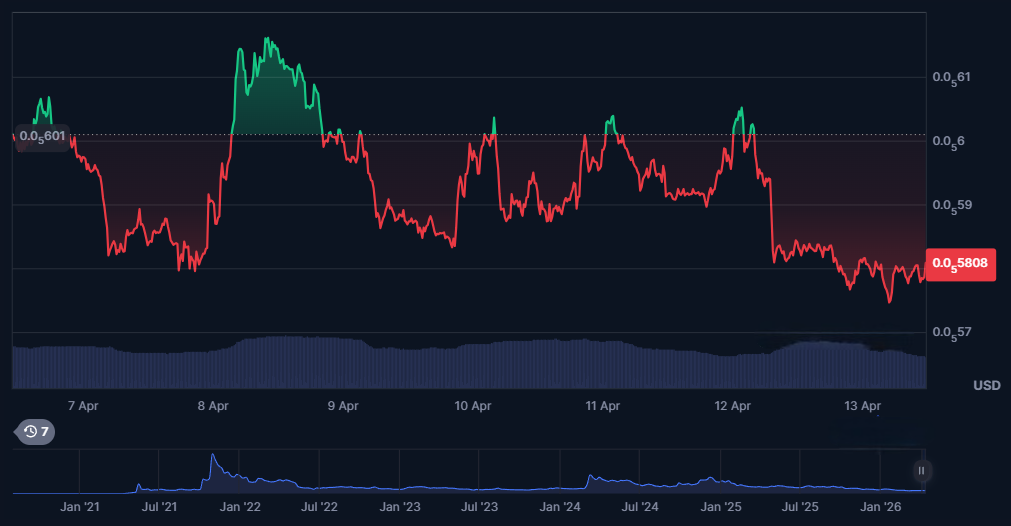
Shiba Inu Weekly Technical Analysis: Key Support and Resistance Levels to Watch
Shiba Inu (SHIB) continues to trade within a well-defined weekly range, reflecting a balance between accumulation and distribution as the broader crypto market consolidates. Despite its meme coin origins, SHIB has developed a structured technical profile, with traders closely monitoring key support and resistance levels for signs of the next major move.
Market Structure: Consolidation Within a Broader Trend
On the weekly timeframe, SHIB is currently in a sideways consolidation phase following previous periods of volatility. This structure indicates that the market is stabilizing after sharp price swings.
Such consolidation often acts as a base-building phase, where price prepares for a breakout. However, the direction of that breakout remains uncertain, making current levels critically important.
Key Support Levels: Foundation for Stability
1. Immediate Support Zone
The nearest support level has consistently held during recent pullbacks, showing that buyers are actively defending this zone. This area acts as a short-term safety net for price action.
Repeated bounces from this level indicate strong demand, suggesting that accumulation may be taking place.
2. Secondary Support Level
Below the immediate support lies a deeper demand zone that aligns with previous weekly lows. This level is crucial for maintaining the broader structure.
A breakdown below this zone could trigger accelerated selling pressure, potentially leading to a deeper correction.
3. Macro Support Structure
On a larger timeframe, SHIB still respects a long-term support trendline formed during earlier accumulation phases. This indicates that the overall structure is not fully bearish.
Holding this macro support keeps the possibility of long-term bullish continuation intact.
Resistance Levels: Barriers to Upside Momentum
1. Immediate Resistance
SHIB is currently facing resistance near recent weekly highs, where price has struggled to break through. This level is acting as a short-term ceiling.
A breakout above this zone would signal renewed bullish momentum and could attract additional buyers.
2. Mid-Range Resistance Cluster
This resistance area is reinforced by previous rejections and key moving averages. It represents a significant hurdle for bulls.
Breaking above this level could trigger momentum-driven buying and push price toward higher targets.
3. Major Resistance Zone
At higher levels, SHIB faces a strong resistance zone that marks the top of its previous rally. This is a critical level for confirming a long-term trend reversal.
A sustained move above this zone would shift market sentiment decisively in favor of bulls.
Technical Indicators: Signals to Watch
RSI (Relative Strength Index)
The RSI on the weekly chart is currently in a neutral range, indicating a balance between buying and selling pressure. This suggests that SHIB is not overbought or oversold.
A move above key RSI levels could signal strengthening bullish momentum, while a drop could indicate renewed weakness.
Moving Averages
SHIB is trading near key moving averages, which are acting as dynamic resistance. These levels are crucial for determining trend direction.
A breakout above these averages would indicate a shift toward bullish conditions.
Volume Analysis
Volume has remained relatively stable, with occasional spikes during price movements. This suggests moderate market participation.
An increase in volume during a breakout would provide confirmation of a sustained move.
Bullish Scenario: Potential for Upward Expansion
Accumulation Phase
The current consolidation may represent an accumulation phase, where larger players are gradually building positions.
This phase often precedes a breakout, especially if supported by increasing volume.
Higher Low Formation
SHIB has shown signs of forming higher lows on lower timeframes, indicating that buyers are stepping in earlier during dips.
This is an early signal of strengthening bullish momentum.
Breakout Potential
A confirmed breakout above resistance levels could lead to:
- Increased buying pressure
- Higher trading volumes
- Retest of previous highs
Ecosystem Growth
Developments within the Shiba Inu ecosystem, including projects like Shibarium and token utility expansion, continue to support long-term demand.
Bearish Risks: Downside Scenarios
Resistance Rejection
If SHIB fails to break resistance, it could form a lower high, reinforcing a bearish structure.
This would likely lead to continued consolidation or a move back toward support.
Breakdown Below Support
A drop below key support levels could trigger:
- Stop-loss cascades
- Increased selling pressure
- Retest of lower demand zones
Weak Market Conditionsa
SHIB is highly influenced by the broader crypto market. Weakness in major assets could lead to amplified downside in SHIB.
Meme Coin Volatility
As a meme coin, SHIB is prone to sentiment-driven volatility, making price movements unpredictable.
Recent News and Market Sentiment
Shiba Inu continues to benefit from strong community support and ongoing ecosystem developments. News around scaling solutions and increased adoption has helped maintain interest.
However, the lack of major catalysts has kept price action relatively subdued, contributing to the current consolidation phase.
Weekly Outlook: Breakout or Continued Range?
Bullish Case:
- Support levels hold
- Resistance breaks
- Volume increases
- Price targets higher levels
Bearish Case:
- Resistance holds
- Support breaks
- Selling pressure increases
- Price moves lower
Conclusion
Shiba Inu is currently at a critical technical stage, with key support and resistance levels defining its next move. The weekly structure suggests consolidation, but underlying signals point to a potential breakout if resistance levels are cleared.
Traders should closely monitor:
- Support stability
- Resistance breakouts
- Volume confirmation
- Broader market trends
As SHIB continues to consolidate, the likelihood of a significant move increases. Whether bullish or bearish, the next breakout will likely set the tone for the coming weeks.


Potrebbe anche piacerti
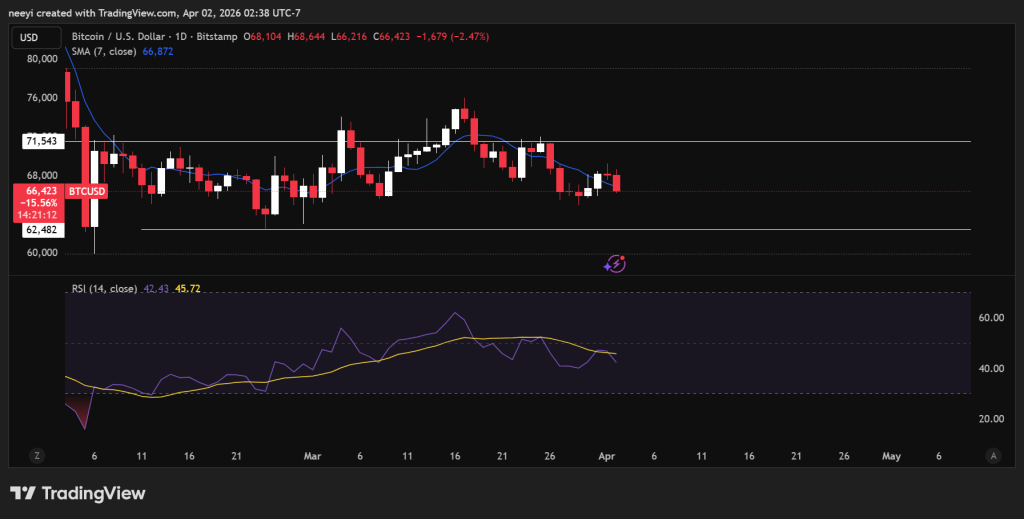
In 3-6 Days, Bitcoin Enters Its Last Dip Before the Next Leg Higher – Watch This Level
Trump struggles to gather GOP support for his unpopular surveillance program


