

FET Price Prediction: Can Bulls Break $0.70 Resistance to Approach $1.60?

- FET forms a symmetrical triangle pattern, indicating a potential breakout as price nears trendline convergence.
- RSI at 45 shows neutral momentum, while MACD below zero signals weak buying pressure and sideways sentiment.
- Key breakout targets sit at $0.88, $1.15, and $1.60, with heavy resistance at $0.70–$0.90.
Artificial Superintelligence Alliance (FET) is trading under increasing bearish pressure with the overall market. The FET price over the last 24 hours is down by 4.58%, and over the last week it is also down by 4.66%.
At the time of writing, FET is trading at $0.6479 with a 24-hour trading volume of $105.46 million, up by 5.05% over the last 24 hours. The token has a market capitalization of $1.53 billion, which has declined by 4.6%.
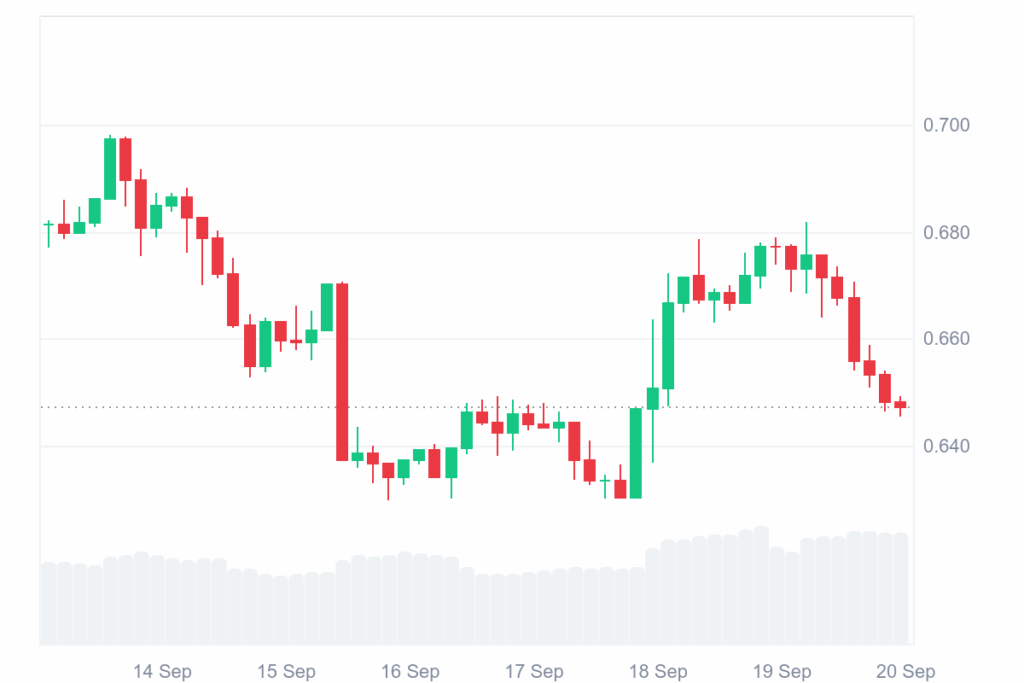
Source: CoinMarketCap
The general trend in the crypto market has turned bearish with a depreciation in speculators’ interest and BTC’s downward momentum. This move has barely impacted the overall market, including altcoins like FET.
FET Token Performance Hints at Future Gains
According to the data from CryptoRank, in 2025, the year opened weak with drops of -19.3% in January, -36.3% in February, and -30.4% in March. A rebound came in April (+62.3%), followed by smaller growth in May (+2.41%). Summer turned negative with -10.4% in June, -1.15% in July, and -8.47% in August, before a modest recovery in September (+5.59%).

Source: CryptoRank
In 2024, January started at -15.7%, but February and March surged with +159.8% and +106.9%. April fell -33.5%, while May added +5.57%. Mid-year slipped again with -33.3% in June, -19.1% in July, and -1.98% in August, then September jumped +34.3%. The year closed mixed at -15% in October, +46.5% in November, and -33.2% in December.
Also Read: FET Price Analysis: Bulls Target $1.00 as Market Shows Cautious Optimism
FET Eyes $1.60 Breakout as Symmetrical Triangle Tightens
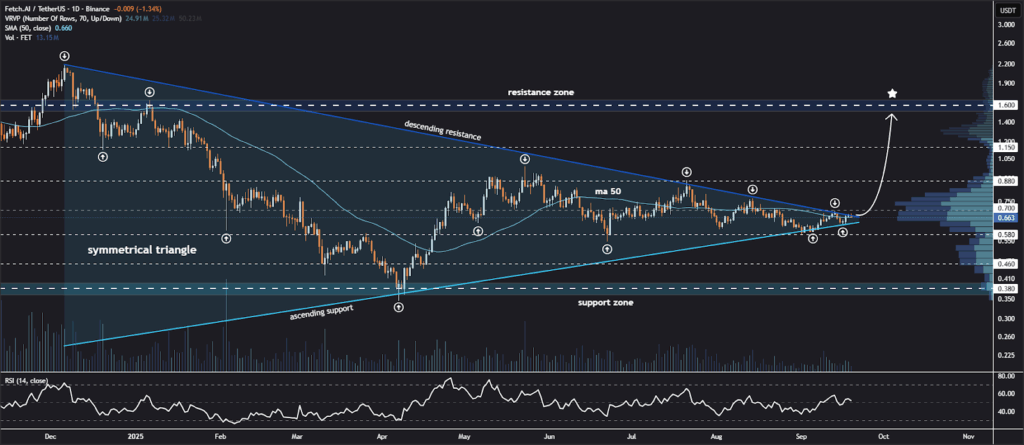
According to the crypto analyst Jonathan Carter, the FET token is nearing a crucial breakout since a symmetrical triangle formation on the daily chart is fast approaching its vertex. Price compression within contracting trendlines, growing trade volumes, and gaining upwards momentum all signal a decisive direction anytime soon.
Source: X
If this breakout comes true to the upside, targets are at $0.88, $1.15, and $1.60, and these are key levels of resistance ahead. As AI-related tokens gain wider appeal within the space itself, FET’s potential rally can gain wider investor attention and bring some renewed momentum.
FET Technical Indicators Suggest Persistent Downtrend
The FET chart shows a long-term downtrend after reaching its highest above $3 early in 2024. The price is at about $0.64, significantly lower compared to key EMAs (20/50/100/200) at $0.70 and $0.89, and is forming excellent resistance. This is an indication of bearish momentum, with the market struggling to touch larger levels.

Source: TradingView
The RSI is at 45 with neutral-to-weak momentum and neither overbought nor oversold signals. The MACD is below zero, with its histogram indicating horizontal momentum and weak buying pressure. Overall, consolidation is dominating, but it requires a breakout above $0.70–$0.90 to reverse direction.
Also Read: FET Price Prediction: Symmetrical Triangle Signals Breakout Toward $1.60 Target


Potrebbe anche piacerti

The changing face of elder care in Malaysia — Sayed Mohammad Reza Yamani Sayed Umar
GOP lawmakers want nothing to do with Trump's ballroom chaos: report

Not a loophole: Singapore AI export controls let China tap US AI legally


Notizie di tendenza
Altro
