

TRON Price Today: Market Stability Hints at Upcoming Volatility
TRON (TRX) is currently showing signs of short-term stability, trading around the $0.32–$0.33 range after a gradual upward move. While the price action appears relatively calm, technical indicators suggest that this stability may be temporary, potentially leading to a significant volatility expansion in the coming sessions.
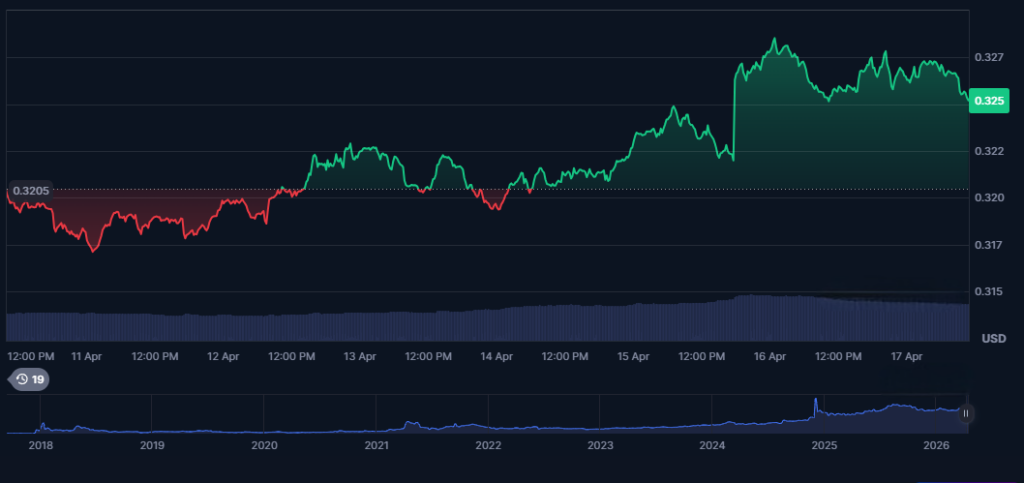
The recent chart structure highlights a steady climb followed by tight consolidation, a classic setup that often precedes a breakout or breakdown. For traders, this phase is critical, as it provides early signals of the next major move.
Current Price Action Overview
The latest price movement shows TRX transitioning from a minor downtrend into a controlled uptrend. After dipping below $0.32 earlier in the week, the asset regained strength and pushed toward the $0.325 level.
This recovery indicates buyer support at lower levels, preventing further downside. However, the price is now moving sideways, suggesting that both bulls and bears are waiting for confirmation before taking larger positions.
Such consolidation phases are often a precursor to high-volatility breakouts, especially when supported by tightening price ranges.
Key Support Levels
Support levels are crucial in determining whether the current trend can sustain itself.
Immediate Support:
- $0.320: Recently tested and held multiple times
Strong Support:
- $0.315: Key demand zone visible in recent price structure
Major Support:
- $0.300: Psychological and long-term support
Holding above $0.320 keeps the short-term bullish structure intact. A breakdown below this level could lead to a retest of $0.315, and potentially $0.300 if selling pressure increases.
Resistance Levels to Watch
Resistance zones are currently limiting TRX’s upward momentum.
Immediate Resistance:
- $0.327: Recent local high
Key Breakout Level:
- $0.330: Critical level for bullish continuation
Major Resistance:
- $0.350: Strong historical supply zone
A clean breakout above $0.330 with strong volume could trigger a rapid upward move, potentially targeting the $0.35 region. Failure to break this level may keep TRX in consolidation.
Technical Indicators and Signals
Relative Strength Index (RSI)
The RSI is hovering near the neutral zone, indicating balanced momentum. This suggests that TRX is neither overbought nor oversold, leaving room for movement in either direction.
A move above 60 would confirm bullish strength, while a drop below 45 could signal increasing bearish pressure.
Moving Averages
TRX is currently trading above short-term moving averages, which are acting as dynamic support. This supports a short-term bullish bias.
If price continues to hold above these levels, it strengthens the probability of an upward breakout. However, losing these supports could shift sentiment toward bearish territory.
Volume Analysis
Volume has remained relatively stable, with slight increases during upward moves. This indicates moderate buying interest but not enough to confirm a strong breakout yet.
A significant spike in volume will be the key trigger for the next major move, signaling increased market participation.
Why Stability Often Leads to Volatility
Periods of low volatility and tight price ranges often precede large market moves. This is due to liquidity buildup, where orders accumulate on both sides of the market.
Once a breakout occurs, these orders are triggered, leading to rapid price movement. In TRX’s case, the narrowing range between $0.320 and $0.330 suggests that such a move may be imminent.
Market Drivers and Recent Developments
Strong Network Activity
TRON continues to dominate in stablecoin transactions, particularly USDT transfers. Its low fees and fast processing times make it a preferred network for high-volume activity.
DeFi and Ecosystem Growth
The expansion of TRON’s DeFi ecosystem is supporting long-term demand for TRX. Increased total value locked (TVL) reflects growing user engagement.
Broader Market Influence
TRX’s movement is closely tied to major cryptocurrencies like Bitcoin and Ethereum. A bullish trend in the broader market typically supports TRX’s upward movement.
Bullish Scenario
If TRX breaks above key resistance:
- Break above $0.330 could trigger a rally toward $0.350
- Increased volume would confirm bullish momentum
- Positive market sentiment could accelerate gains
This scenario would indicate that consolidation has resolved to the upside.
Bearish Scenario
If TRX fails to hold support:
- Breakdown below $0.320 could lead to $0.315 retest
- Further weakness may push price toward $0.300
- Negative market sentiment could increase selling pressure
This would signal a shift toward bearish control.
Final Outlook
TRON is currently in a low-volatility consolidation phase, with price stability masking the potential for a sharp move. The narrowing range between support and resistance suggests that a breakout is approaching.
The key levels to watch are $0.320 support and $0.330 resistance. A decisive move beyond these levels, supported by volume, will determine the next trend direction.
With strong fundamentals, consistent network activity, and growing ecosystem adoption, TRX remains well-positioned. However, traders should remain cautious and wait for confirmation before entering positions, as volatility is likely to increase in the near term.


Potrebbe anche piacerti

Trump pours gas on GOP civil war with new attacks on MAGA icons: 'I should do a list'

Singapore Gulf Bank Unveils Stablecoin Mint and Redeem Service for Institutional Clients


