XRP Price Analysis: Technical Indicators Point to Potential 35% Breakout on the Horizon
Key Takeaways
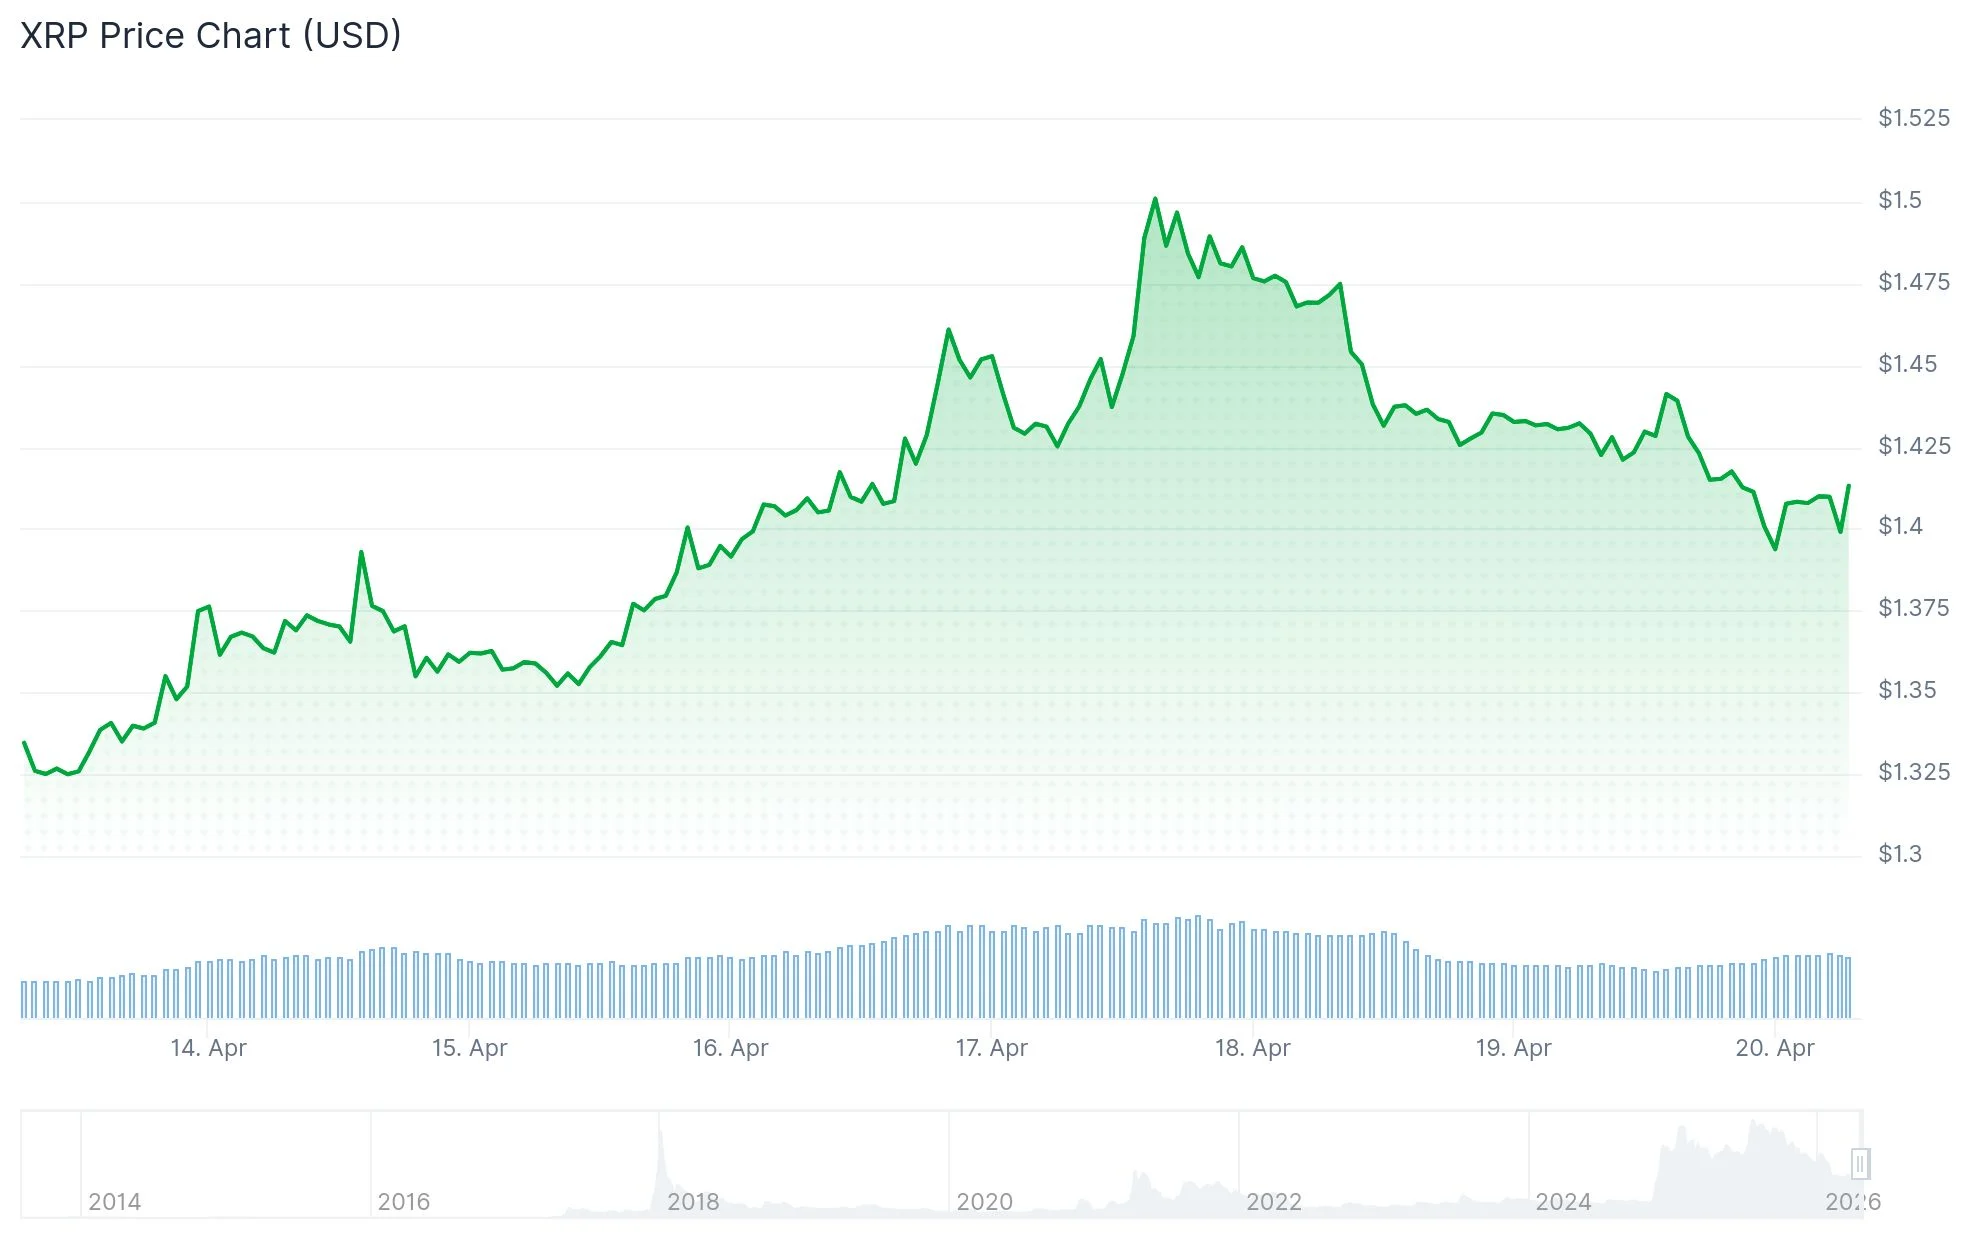
- Ripple’s XRP is currently trading in a narrow range between $1.40 and $1.41, caught between $1.35 support and $1.50 resistance levels.
- Daily inflows into XRP investment vehicles reached $13.74 million, bringing total net inflows to an impressive $1.27 billion.
- The 30-day Realized Volatility Index has plummeted to 0.42, marking the lowest level in multiple years and typically signaling an impending significant price movement.
- The token remains positioned beneath its 50-day, 100-day, and 200-day moving averages, each displaying downward trajectories.
- Technical analyst Ali Charts identified a symmetrical triangle formation suggesting a possible 35% price swing in the near future.
Ripple’s XRP has established a firm position around the $1.40–$1.41 price point, locked within a narrow trading corridor that has left both bullish and bearish traders waiting for clarity. The digital asset has managed to climb approximately 8% throughout the past week, benefiting from renewed optimism across cryptocurrency markets. However, the critical $1.50 threshold continues to prove elusive.
 XRP Price
The $1.50 price level has functioned as persistent resistance throughout recent trading sessions. Market participants who accumulated positions at lower entry points have been consistently taking profits near this level, creating selling pressure that effectively caps upward momentum.
From a macroeconomic perspective, market participants are closely monitoring the upcoming Federal Reserve policy decision scheduled for April 28. Any indications regarding future interest rate adjustments could substantially influence sentiment throughout digital asset markets, with XRP being no exception.
Concurrently, Bitcoin has surged past the $77,000 mark while Ethereum successfully broke through $2,300, triggering renewed buying activity across the cryptocurrency ecosystem. Alternative tokens including Solana, Cardano, and Dogecoin have similarly registered modest appreciation during this timeframe.
Capital Continues Flowing Into XRP Products
Investment vehicles focused on XRP have maintained consistent capital attraction. Recent data shows daily inflows of $13.74 million, elevating the aggregate net inflow figure to $1.27 billion. This sustained influx demonstrates continued institutional appetite for the asset.
U.S.-listed spot Bitcoin exchange-traded funds registered $664 million in net inflows during a recent trading session, representing the fourth consecutive day of positive flows. Spot Ethereum ETFs simultaneously captured $127 million in fresh capital, extending their inflow momentum to seven straight days.
Technical Analysis Reveals Key Patterns
From a technical perspective, XRP remains confined within clearly defined boundaries. Daily chart analysis identifies support solidly established around $1.35 with resistance consistently capping advances at $1.50. The MACD indicator displays gradual upward curvature, while histogram bars are contracting, indicating diminishing bearish pressure.
The Relative Strength Index currently registers near 54, representing neutral territory. This suggests equilibrium between buying and selling forces at present price levels.
Prominent cryptocurrency analyst Ali Charts highlighted on the social platform X that XRP is developing a symmetrical triangle formation, a technical pattern frequently associated with explosive directional moves. According to Ali Charts’ analysis, this pattern indicates a potential 35% price movement, although the ultimate direction remains undetermined.
Examining longer timeframes reveals a more conservative outlook. XRP reached a peak above $3.00 during mid-2025 before entering a sustained decline characterized by successive lower highs and lower lows. A significant volume-driven selloff during early February 2026 eliminated overleveraged positions and recalibrated market structure, yet price action has remained largely stagnant since.
XRP’s 30-day Realized Volatility Index has contracted to approximately 0.42, representing the most compressed reading observed since 2024. Historical precedent suggests such volatility compression typically precedes substantial price movements rather than prolonged lateral consolidation.
Blockchain analytics reveal that most current holders remain in unrealized loss positions. The MVRV ratio currently sits at levels historically associated with market distress periods, while the percentage of supply in profit remains notably depressed. XRP has depreciated roughly 30% when measured over the trailing twelve months.
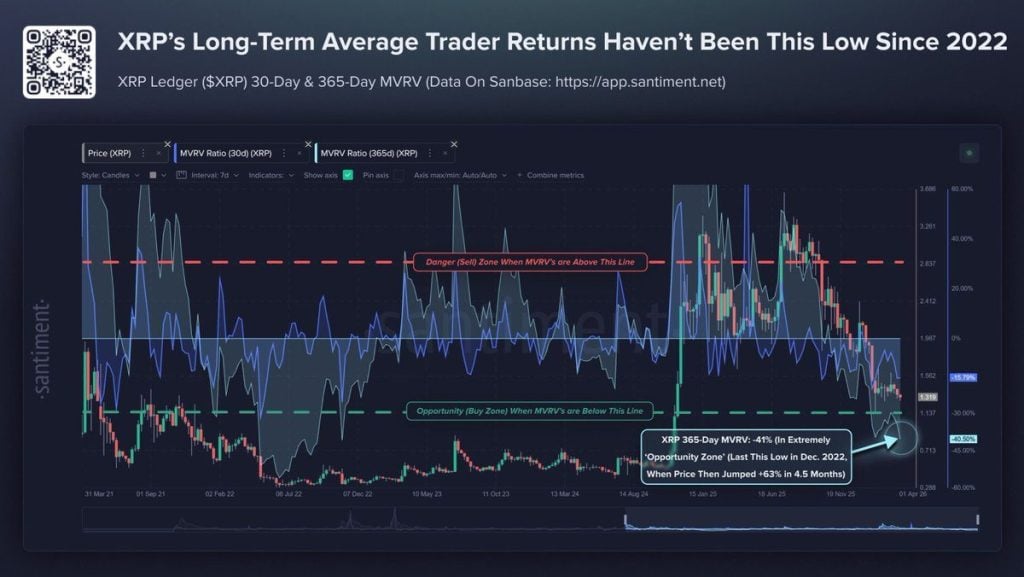 Source: Santiment
The crucial price level demanding attention is $1.50. A decisive break and sustained hold above this threshold would represent the first unambiguous indication of a potential trend reversal. Conversely, should support at $1.30 fail, limited structural support exists at lower levels.
The post XRP Price Analysis: Technical Indicators Point to Potential 35% Breakout on the Horizon appeared first on Blockonomi.


Potrebbe anche piacerti

Early Ozak AI Participants at $0.014 Could Be Positioned for Multi-Hundred-X Returns if Long-Term Targets Hold

Dow Jones futures plunge as risk aversion increases after Trump’s comments