The post Terra Classic Price Outlook: LUNC Price Breakout Holds, What’s Next? appeared first on Coinpedia Fintech News Terra Classic price is moving higher, withThe post Terra Classic Price Outlook: LUNC Price Breakout Holds, What’s Next? appeared first on Coinpedia Fintech News Terra Classic price is moving higher, with

Terra Classic Price Outlook: LUNC Price Breakout Holds, What’s Next?

2026/04/24 21:00
3 min di lettura
Per feedback o dubbi su questo contenuto, contattateci all'indirizzo [email protected].
LUNC Price Flashes Early Signs of a Macro Bottom—Is a 288% Technical Reversal Possible?

The post Terra Classic Price Outlook: LUNC Price Breakout Holds, What’s Next? appeared first on Coinpedia Fintech News

Terra Classic price is moving higher, with LUNC token clearing resistance and holding above its consolidation range for the first time in months. While previous attempts failed to sustain, the current move is showing early signs of acceptance, with price maintaining strength above the breakout zone. 

Meanwhile, rising participation is beginning to support the shift. As the structure transitions into expansion, the window for confirmation is narrowing. With momentum building and resistance now behind, the focus shifts to whether this LUNC price breakout can extend into a larger move higher.

Breakout Holds as Terra Classic Price Transitions Into Expansion

While previous price action remained confined within a horizontal range, the current move has shifted Terra Classic price into a higher trading zone. As LUNC price cleared resistance, the former ceiling is now acting as support, with repeated holds confirming structural strength. Meanwhile, the absence of immediate rejection reinforces that the breakout is being accepted by the market. With higher lows beginning to form above the breakout level, the structure reflects controlled continuation rather than exhaustion.

Terra classic price

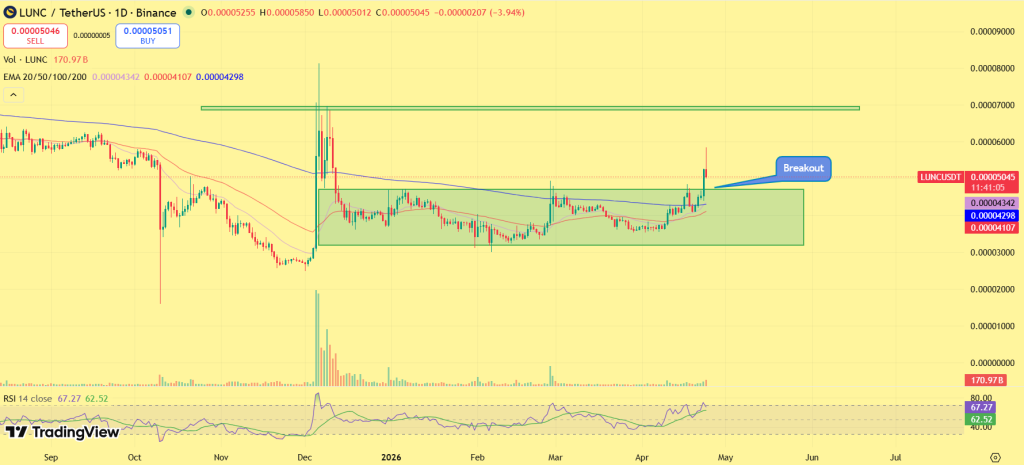
As long as Terra Classic price holds above the $0.000045–$0.000048 region, the breakout remains valid, keeping the path open toward $0.000060 and potentially higher levels. However, a failure to maintain this zone would weaken the structure and pull LUNC price back into consolidation.

Participation Expands as Volume and Open Interest Surge

While price structure strengthens, derivatives data confirms that participation is returning to the market. As futures volume has surged significantly, rising over 500%, and open interest climbs above $12 million, activity is expanding rapidly. Meanwhile, this increase reflects traders positioning around the breakout rather than fading it.

LUNC volume

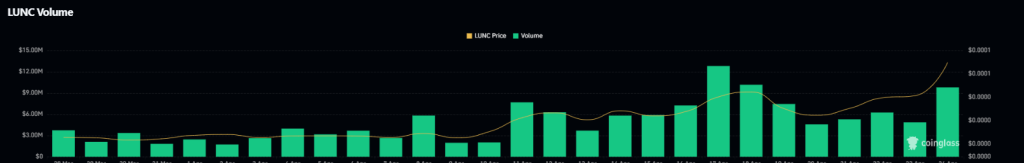
With both volume and open interest rising together, the move is supported by engagement rather than isolated price action. However, sharp increases in participation can also introduce volatility if positioning becomes crowded, making stability above the breakout zone critical.

Narrative Momentum Returns as Market Attention Builds

While structure leads the move, broader narrative elements are beginning to support Terra Classic price. As discussions around token burns, exchange activity, and ecosystem upgrades regain traction, sentiment is gradually improving. Meanwhile, increased social engagement reflects renewed interest from market participants.

With narrative momentum aligning alongside technical strength, LUNC price is attracting attention beyond short-term trading flows. However, sustained continuation will depend on whether this attention translates into consistent demand rather than temporary spikes.

Final Words 

As Terra Classic price continues to hold above its breakout zone, the structure remains aligned with continuation rather than reversal. While LUNC price maintains stability above reclaimed resistance, higher lows reinforce demand across the current range. Meanwhile, rising participation adds depth to the move, supporting further expansion.

With breakout confirmation in place and structure holding, the market is transitioning into a phase where continuation becomes the primary focus. With the foundation now established, the next move will be defined not by breakout, but by how effectively price builds on it.

Opportunità di mercato
Logo Terraport
Valore Terraport (TERRA)
$0.001288
$0.001288$0.001288
+3.12%
USD
Grafico dei prezzi in tempo reale di Terraport (TERRA)
Disclaimer: gli articoli ripubblicati su questo sito provengono da piattaforme pubbliche e sono forniti esclusivamente a scopo informativo. Non riflettono necessariamente le opinioni di MEXC. Tutti i diritti rimangono agli autori originali. Se ritieni che un contenuto violi i diritti di terze parti, contatta [email protected] per la rimozione. MEXC non fornisce alcuna garanzia in merito all'accuratezza, completezza o tempestività del contenuto e non è responsabile per eventuali azioni intraprese sulla base delle informazioni fornite. Il contenuto non costituisce consulenza finanziaria, legale o professionale di altro tipo, né deve essere considerato una raccomandazione o un'approvazione da parte di MEXC.

Potrebbe anche piacerti

Sen. Tillis lifts block on Fed chair nominee Warsh, clearing path for confirmation

Sen. Tillis lifts block on Fed chair nominee Warsh, clearing path for confirmation

The post Sen. Tillis lifts block on Fed chair nominee Warsh, clearing path for confirmation appeared on BitcoinEthereumNews.com. Sen. Thom Tillis has removed his
Condividi
BitcoinEthereumNews2026/04/27 13:57
Ethereum koers toont zeldzaam dubbel koopsignaal en richt zich op $4.550

Ethereum koers toont zeldzaam dubbel koopsignaal en richt zich op $4.550

Connect met Like-minded Crypto Enthusiasts! Connect op Discord! Check onze Discord   Ethereum laat op de uurgrafiek twee opeenvolgende TD Sequential koopsignalen zien. Deze indicator meet uitputting in een trend en geeft vaak een signaal dat de verkoopdruk kan afnemen. Dit dubbele signaal verschijnt rond het niveau van $4.516, waar de ETH prijs kortstondig steun vindt. Dit type formatie komt zelden voor en wordt daarom extra nauwlettend gevolgd. Wat gaat de Ethereum koers hiermee doen? Ethereum koers test steun rond $4.516 De scherpe daling van de Ethereum koers vanaf de prijszone rond $4.800 bracht de ETH prijs in korte tijd naar ongeveer $4.516. Op dit niveau trad duidelijke koopactiviteit op, waardoor de neerwaartse beweging tijdelijk werd gestopt. Het dubbele signaal dat door de TD Sequential indicator is gegenereerd, viel precies samen met dit prijspunt. De TD Sequential is opgebouwd uit negen candles die een trend meetellen. Wanneer de negende candle verschijnt, kan dit duiden op een trendomslag. In dit geval verschenen zelfs twee signalen kort na elkaar, wat aangeeft dat de verkoopdruk mogelijk uitgeput is. Het feit dat dit gebeurde in een zone waar ETH kopers actief bleven, maakt het patroon extra opvallend. TD Sequential just flashed two buy signals for Ethereum $ETH! pic.twitter.com/JPO8EhiEPi — Ali (@ali_charts) September 16, 2025 Welke crypto nu kopen?Lees onze uitgebreide gids en leer welke crypto nu kopen verstandig kan zijn! Welke crypto nu kopen? Fed-voorzitter Jerome Powell heeft aangekondigd dat de rentes binnenkort zomaar eens omlaag zouden kunnen gaan, en tegelijkertijd blijft BlackRock volop crypto kopen, en dus lijkt de markt klaar om te gaan stijgen. Eén vraag komt telkens terug: welke crypto moet je nu kopen? In dit artikel bespreken we de munten die… Continue reading Ethereum koers toont zeldzaam dubbel koopsignaal en richt zich op $4.550 document.addEventListener('DOMContentLoaded', function() { var screenWidth = window.innerWidth; var excerpts = document.querySelectorAll('.lees-ook-description'); excerpts.forEach(function(description) { var excerpt = description.getAttribute('data-description'); var wordLimit = screenWidth wordLimit) { var trimmedDescription = excerpt.split(' ').slice(0, wordLimit).join(' ') + '...'; description.textContent = trimmedDescription; } }); }); Technische indicatoren schetsen herstelkans voor ETH Naast de dubbele koopsignalen verstrekken ook andere indicatoren belangrijke aanwijzingen. Tijdens de daling van de ETH koers waren grote rode candles zichtbaar, maar na de test van $4.516 stabiliseerde de Ethereum koers. Dit wijst op een mogelijke verschuiving in het evenwicht tussen de bears en bulls. Als deze opwaartse beweging doorzet, liggen de eerste weerstanden rond $4.550. Daarboven wacht een sterkere zone rond $4.650. Deze niveaus zijn in eerdere Ethereum sessies al meerdere keren getest. Een doorbraak zou ruimte openen richting de all-time high van ETH rond $4.953. Wanneer de prijs toch opnieuw onder $4.516 zakt, liggen er zones rond $4.500 en $4.450 waar grotere kooporders worden verwacht. Deze niveaus kunnen als een vangnet fungeren, mocht de druk opnieuw toenemen. Marktdynamiek bevestigt technische indicatoren De huidige situatie volgt op een bredere correctie in de cryptomarkt. Verschillende vooraanstaande crypto tokens zagen scherpe koersdalingen, waarna traders op zoek gingen naar signalen voor een mogelijke ommekeer. Dat juist Ethereum nu een dubbel TD Sequential signaal toont, versterkt de interesse in dit scenario. Fundamenteel blijft Ethereum sterk. Het aantal ETH tokens dat via staking is vastgezet, blijft groeien. Dat verkleint de vrije circulatie en vermindert verkoopdruk. Tegelijk blijft het netwerk intensief gebruikt voor DeFi, NFT’s en stablecoins. Deze activiteiten zorgen voor een stabiele vraag naar ETH, ook wanneer de prijs tijdelijk onder druk staat. Fundamentele drijfveren achter de Ethereum koers De Ethereum koers wordt echter niet alleen bepaald door candles en patronen, maar ook door bredere factoren. Een stijgend percentage van de totale ETH supply staat vast in staking contracten. Hierdoor neemt de liquiditeit op exchanges af. Dit kan prijsschommelingen versterken wanneer er plotseling meer koopdruk ontstaat. Daarnaast is Ethereum nog steeds het grootste smart contract platform. Nieuwe standaarden zoals ERC-8004 en ontwikkelingen rond layer-2 oplossingen houden de activiteit hoog. Deze technologische vooruitgang kan de waardepropositie ondersteunen en zo indirect bijdragen aan een ETH prijsherstel. Het belang van de korte termijn dynamiek De komende handelsdagen zullen duidelijk maken of de bulls genoeg kracht hebben om door de weerstandszone rond $4.550 te breken. Voor de bears ligt de focus juist op het verdedigen van de prijsregio rond $4.516. De whales, die met grote handelsorders opereren, kunnen hierin een beslissende rol spelen. Het dubbele TD Sequential signaal blijft hoe dan ook een zeldzame gebeurtenis. Voor cryptoanalisten vormt het een objectief aanknopingspunt om de kracht van de huidige Ethereum trend te toetsen. Vooruitblik op de ETH koers Ethereum liet twee opeenvolgende TD Sequential signalen zien op de uurgrafiek, iets wat zelden voorkomt. Deze formatie viel samen met steun rond $4.516, waar de bulls actief werden. Als de Ethereum koers boven dit niveau blijft, kan er ruimte ontstaan richting $4.550 en mogelijk $4.650. Zakt de prijs toch opnieuw onder $4.516, dan komen $4.500 en $4.450 in beeld als nieuwe steunzones. De combinatie van zeldzame indicatoren en een sterke fundamentele basis maakt Ethereum interessant voor zowel technische als fundamentele analyses. Of de bulls het momentum echt kunnen overnemen, zal blijken zodra de Ethereum koers de eerstvolgende weerstanden opnieuw test. Koop je crypto via Best Wallet Best wallet is een topklasse crypto wallet waarmee je anoniem crypto kan kopen. Met meer dan 60 chains gesupport kan je al je main crypto coins aanschaffen via Best Wallet. Best wallet - betrouwbare en anonieme wallet Best wallet - betrouwbare en anonieme wallet Meer dan 60 chains beschikbaar voor alle crypto Vroege toegang tot nieuwe projecten Hoge staking belongingen Lage transactiekosten Best wallet review Koop nu via Best Wallet Let op: cryptocurrency is een zeer volatiele en ongereguleerde investering. Doe je eigen onderzoek. Het bericht Ethereum koers toont zeldzaam dubbel koopsignaal en richt zich op $4.550 is geschreven door Dirk van Haaster en verscheen als eerst op Bitcoinmagazine.nl.
Condividi
Coinstats2025/09/17 23:31
The Worst of Food Inflation Is Yet to Come, Industry Data Suggests

The Worst of Food Inflation Is Yet to Come, Industry Data Suggests

The post The Worst of Food Inflation Is Yet to Come, Industry Data Suggests appeared on BitcoinEthereumNews.com. Food inflation accelerated last month, and several
Condividi
BitcoinEthereumNews2026/04/27 13:48

Roll the Dice & Win Up to 1 BTC

Roll the Dice & Win Up to 1 BTCRoll the Dice & Win Up to 1 BTC

Invite friends & share 500,000 USDT!