

Ethereum (ETH) Price: Institutions Are Quietly Buying While Retail Looks Away — Here’s What the Data Shows
TLDR
- Spot Ethereum ETFs pulled in $70.48 million in net inflows on July 8, a five-day positive streak
- Bitcoin ETFs lost $84.86 million on the same day, showing a clear shift in institutional preference
- ETH is trading below the key $1,826 resistance level, keeping the short-term chart under pressure
- The $1,580 support zone has previously triggered rallies of 149% and 203% in past cycles
- Moving averages signal a sell, but RSI and STOCH indicators lean bullish
Ethereum is trading in a tight range, stuck between weak buying pressure and a key resistance level at $1,826. The price is up around 10% over the past week but has struggled to hold above the levels needed to confirm a stronger recovery.
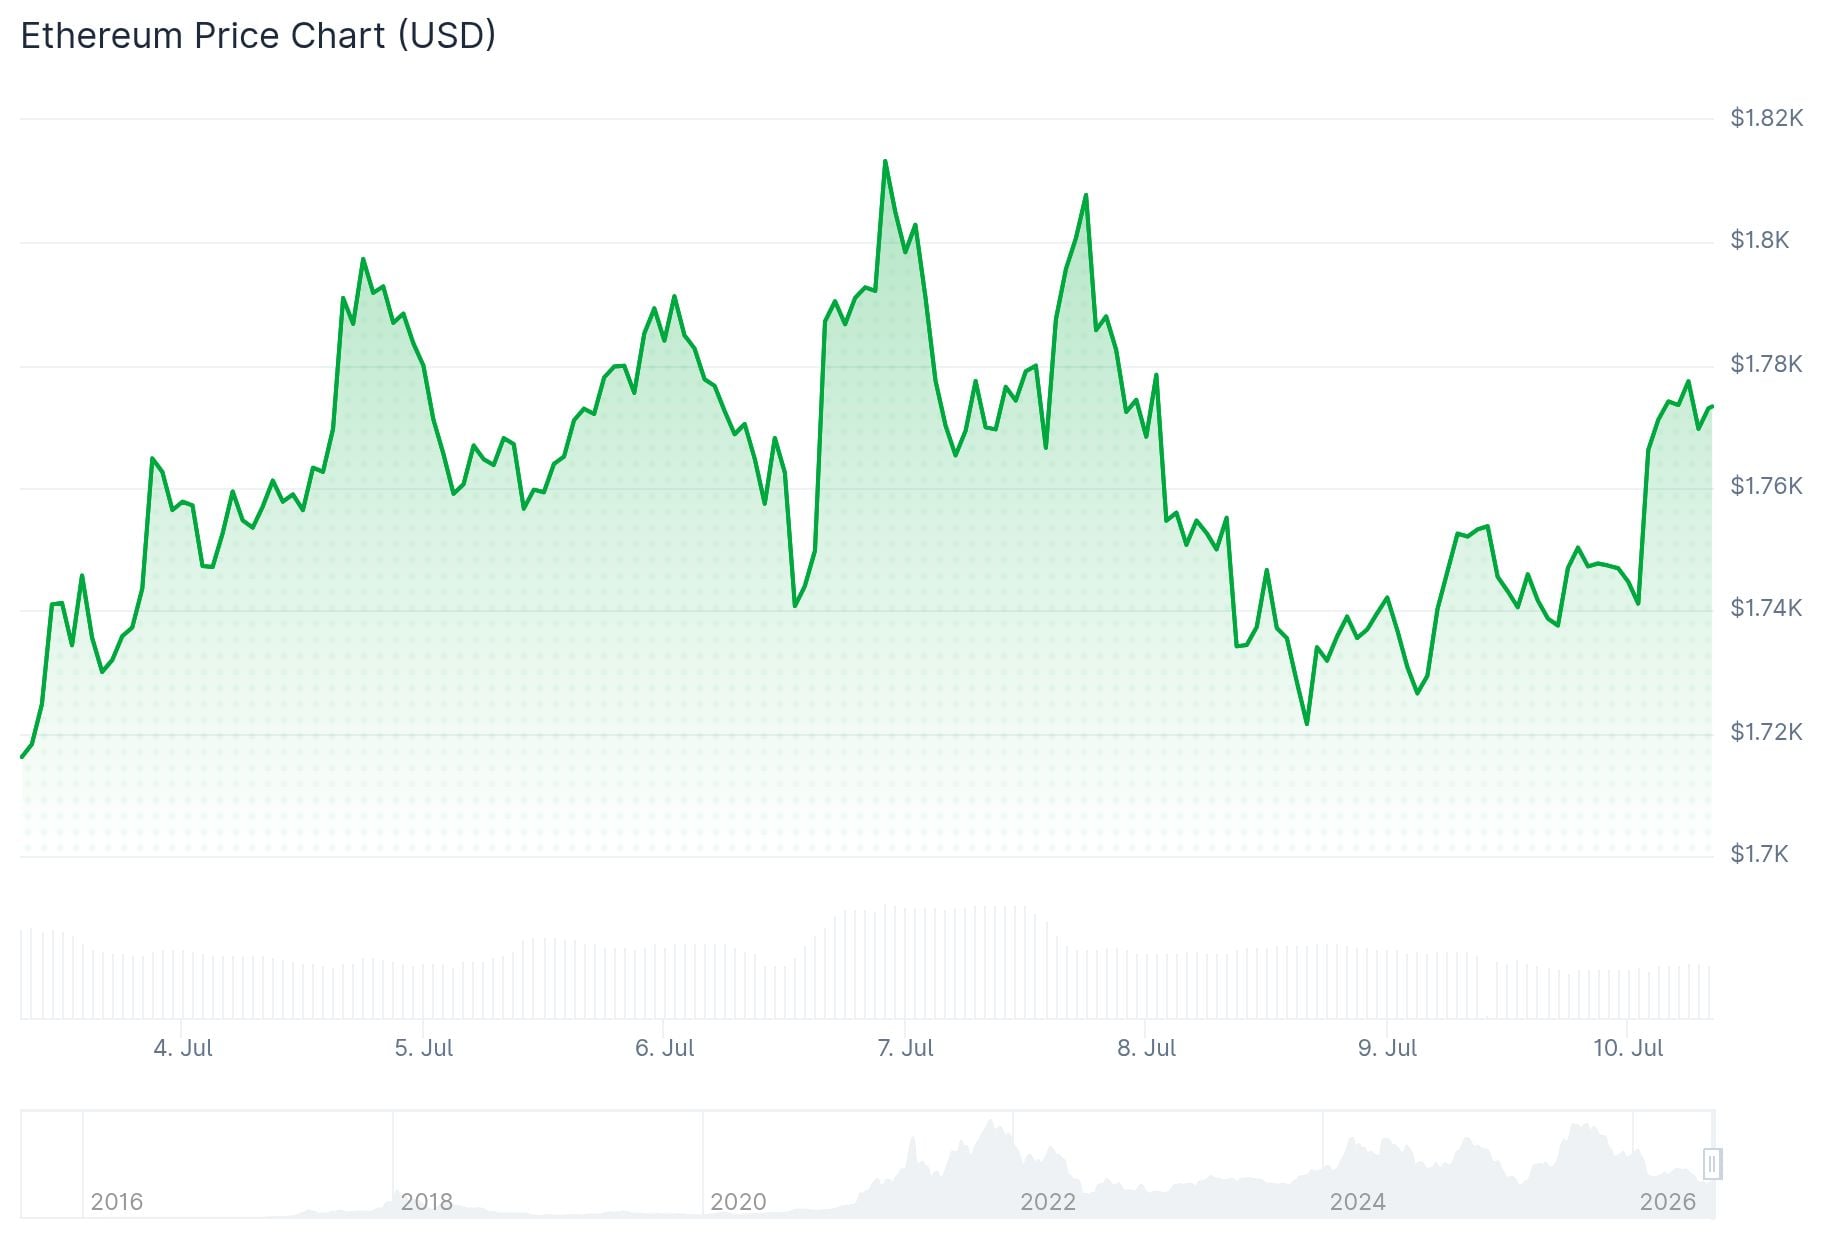 Ethereum (ETH) Price
On July 8, spot Ethereum ETFs recorded $70.48 million in net inflows, according to SosoValue data. That extended a five-day positive streak for ETH funds.
Bitcoin ETFs told a different story on the same day, recording $84.86 million in net outflows. Wall Street appears to be choosing Ethereum over Bitcoin right now.
Crypto analyst CryptosBatman weighed in on X, pointing to a chart pattern forming on ETH. He said Ethereum is printing the same bull flag continuation pattern that previously triggered a large rally, and that a confirmed breakout could send ETH 13% higher.
What the Charts Are Saying
The technical picture is mixed. Moving averages including the MA50, MA100, and MA200 are all giving sell signals. Strong resistance sits at $1,800 to $1,826, which includes the 50-day EMA at $1,804.
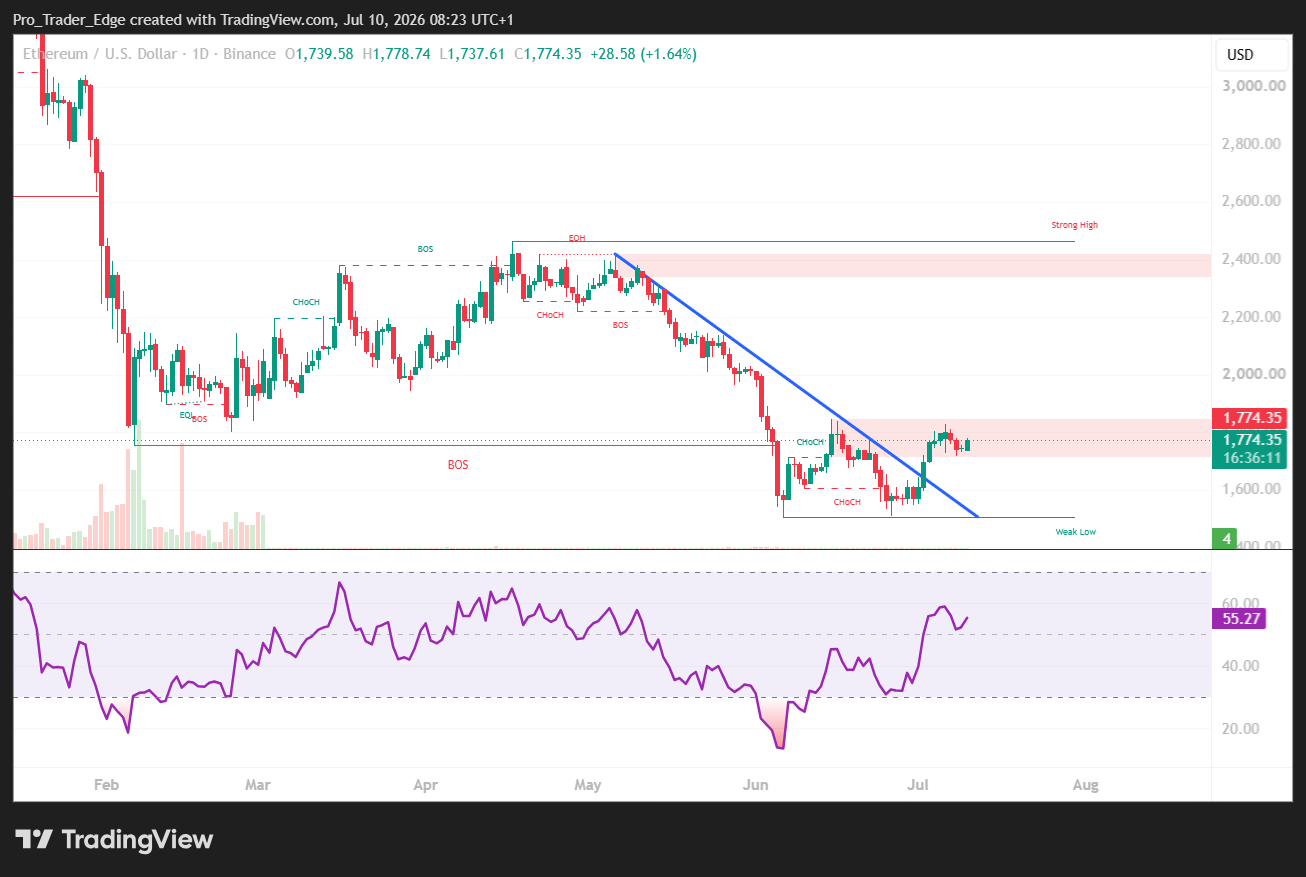 Source: TradingView
However, the RSI (14) and STOCH (9,6) indicators are pointing in a bullish direction. Buyers would need to push ETH above the $1,800–$1,850 zone to confirm any upside move toward $2,000.
Analyst Cryptorphic said ETH remains bearish below $1,826 and that the chart would only start looking more positive if buyers reclaim that level and hold it.
The $1,580 Level Bulls Cannot Afford to Lose
On the weekly chart, ETH is again testing the $1,580 support zone. According to analyst Ali Charts, this level launched a 149% rally in October 2023 and a 203% expansion after the April 2025 test.
ETH has bounced from $1,580 back toward the $1,800 area. But each repeated test of the same support level can reduce buy-side liquidity over time, making it less reliable.
On-chain data from CryptoQuant shows the Net Unrealized Profit/Loss metric improved from -0.46 to -0.30. That means most ETH holders are still in the red.
Ethereum has also held above $1,750 despite recent geopolitical tensions between the US and Iran, a contrast to how ETH has reacted to similar news in the past.
Whale wallets holding 10,000 to 100,000 ETH saw inflows of roughly 100,000 ETH over the past week, though balances have stayed largely flat over the past three weeks.
The post Ethereum (ETH) Price: Institutions Are Quietly Buying While Retail Looks Away — Here’s What the Data Shows appeared first on CoinCentral.


Potrebbe anche piacerti

Covéa Chooses Shift Technology as Strategic Partner for Fraud and Risk Management

Not a loophole: Singapore AI export controls let China tap US AI legally

Top U.S. economist says Gold reversal is imminent


Notizie di tendenza
Altro
