

Pi Coin Price Soars 30% as Bullish Pattern Breaks: But Can the Rally Hold?

Key Insights
- Pi Coin price surged 30% in 7 days, breaking the inverse head and shoulders pattern on March 2.
- Rally exceeded the 17% pattern target, hitting 22% before facing resistance and pullback signals.
- Pi Network price faces a critical test at $0.16 support with the March 12 upgrade as a potential catalyst.
Pi Coin price jumped hard over the past week. From lows near $0.13 in mid-February, it climbed to around $0.196 by March 6, 2026.
That’s roughly a 30% gain in seven days as a bullish technical pattern broke. Buyers rushed in at key levels.
But now questions appear. The Pi Network rally went further than the pattern suggested it should. Warning signals showed up on charts. The next few days will decide if this strength continues or if a pullback starts.
Pi Coin Price: Inverse Head and Shoulders Breaks with 22% Rally
Pi Coin price formed an inverse head and shoulders pattern starting Feb. 15. On March 2, Pi Networ broke above that neckline. Breakouts from this pattern usually signal rallies.
The technical target comes from measuring the distance from the head’s bottom to the neckline. Then you project that same distance upward from the breakout point.
For Pi Network, that measurement gave a 17% target. A reasonable expectation based on pattern size. But the actual rally didn’t stop at 17%. It kept going.
Pi Coin price pushed to 22% gains before hitting resistance. That’s 5% beyond what the pattern predicted.
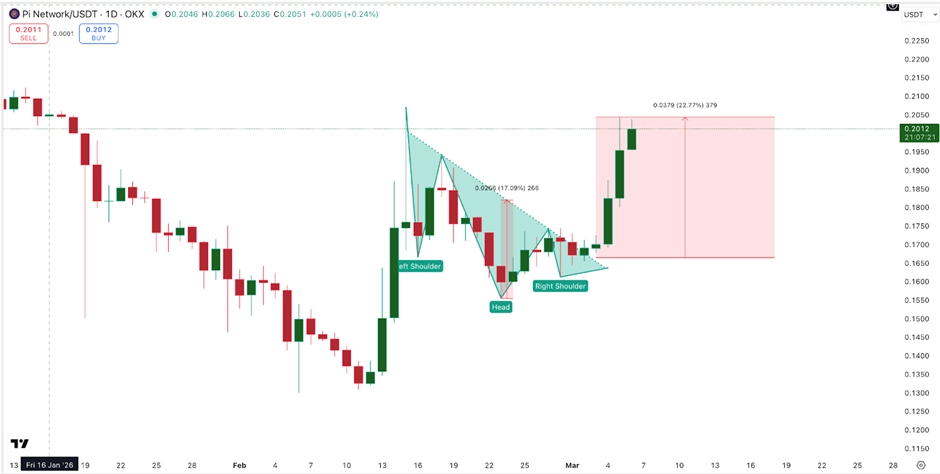 Pi Coin Price Pattern | Source: TradingView
Going past targets shows strong buying, aka, exchange outflows. But it also creates risk.
When rallies extend too far past technical projections, they often pull back. Profit-takers appear. Buyers who got in early start selling. The further past the target you go, the more stretched the move becomes.
Right now, Pi Coin price sits after that 22% run. The pattern worked, and it broke out clean. But the extension beyond 17% means the easy part might be over.
Hidden Divergence at 70 Signal Pullback Risk for Pi Network
Between Feb. 15 and March 5, something important happened under the surface. PI price made a lower high during this period. But the RSI indicator made a higher high at the same time. That mismatch is called hidden bearish divergence.
Hidden bearish divergence means momentum is weakening even though the price looks stable. The Pi Coin price couldn’t push as high as before. But RSI showed buyers trying harder.
When buyers work harder to achieve less, it signals exhaustion. Pullbacks or consolidations usually follow.
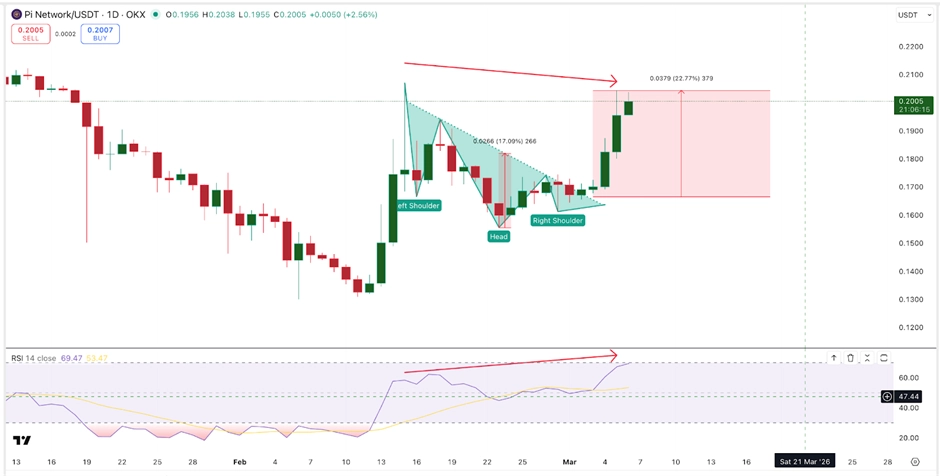 Pi Coin Divergence | Source: TradingView
This divergence formed right as Pi Coin price was rallying past its pattern target. The timing matters. It showed up exactly when the rally extended beyond 17% toward 22%.
The technical indicators were warning that the push was running out of steam. RSI currently sits at 69 to 70. That’s close to the 70 level that marks overbought conditions.
Above 70 means too much buying pressure has built up. Corrections become more likely. Pi Network price isn’t quite there yet. But it’s at the edge.
The combination of hidden bearish divergence plus RSI near 70 creates a clear signal. The rally might pause or reverse soon.
$0.16 Support Holds Key for Pi Coin Price
Pi Coin price now faces a test. The first check is at $0.18, a critical support Holding above that keeps the bullish structure alive. If it breaks, the next level is $0.17. Still manageable.
But $0.16 is the critical line, a level that stands at a 20% pullback zone from the current price level. That would erase most of the recent gains. It would take Pi Network price back toward mid-February levels.
On the upside, breaking above $0.20 changes things for Pi Network. It would remove the hidden bearish divergence signal. It would show that buyers have real strength.
That could open the door to $0.21 and higher targets. But getting there needs sustained buying, not just a quick spike.
 Pi Network Price Levels to Watch | Source: TradingView
March brings catalysts that could help. The v20.2 upgrade becomes mandatory on March 12. It brings smart contracts to the mainnet. That means real functionality instead of only speculation.
Pi Day happens on March 14. The community expects announcements. Validator rewards get distributed later in March.
These events could bring fresh buyers. They might support the price even if technical signals point to a pullback. Or they could fail to offset selling pressure. If hidden divergence and overbought RSI dominate, the catalysts may not matter.
The market will decide in the coming days. Either $0.16 holds, and March upgrades provide fuel for another leg up. Or the technical warnings prove correct, and Pi Coin price corrects lower.
The post Pi Coin Price Soars 30% as Bullish Pattern Breaks: But Can the Rally Hold? appeared first on The Coin Republic.
Potrebbe anche piacerti

STRC Stock Surge: How Much Bitcoin Can Saylor Buy?

Ethereum co-founder Jeffrey Wilcke sends $157M in ETH to Kraken after months of wallet silence
