The 2-year moving average sits at $86,000. At the time of writing Bitcoin is trading at $70,000. Every previous breach of this indicator over thirteen years precededThe 2-year moving average sits at $86,000. At the time of writing Bitcoin is trading at $70,000. Every previous breach of this indicator over thirteen years preceded

Bitcoin Just Broke Below Its 2-Year Moving Average: Level That Has Marked Every Major Cycle Bottom

2026/03/11 00:23
3 min di lettura
Per feedback o dubbi su questo contenuto, contattateci all'indirizzo [email protected].

The 2-year moving average sits at $86,000. At the time of writing Bitcoin is trading at $70,000. Every previous breach of this indicator over thirteen years preceded a significant recovery, though the timeline and magnitude varied considerably each time.

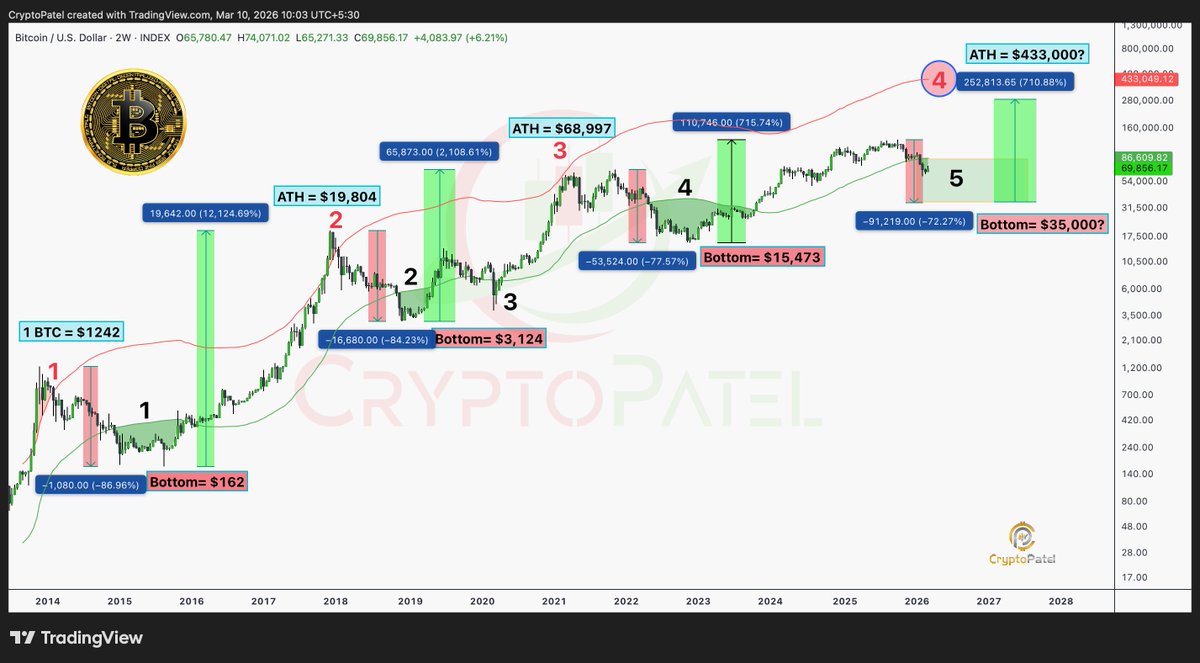
What the 2-Year Moving Average Actually Measures

The 2-year moving average, sometimes called the 2Y MA, calculates Bitcoin’s average closing price across the previous 730 days. Because it smooths out short-term volatility across a two-year window, it tracks the long-term growth trajectory rather than reacting to weekly price swings. When Bitcoin trades below it, the asset is priced below its own two-year average, meaning current buyers are acquiring at a discount to where price has spent most of the preceding period.

Analyst Crypto Patel notes the indicator has functioned as a reliable accumulation signal across every major Bitcoin cycle since 2013. The chart shows five distinct instances where Bitcoin traded below or near the 2-year moving average before subsequent recoveries: bottoms at $162, $3,124, $15,473, and the current test near $60,000 to $70,000.

Source: https://x.com/CryptoPatel/status/2031286437782630847

Each bottom preceded a move to a new all-time high. The recoveries from those levels produced returns of 12x, 2,108%, 715%, and 710% respectively across different timeframes.

The current level sits at approximately $70,000 against a 2-year moving average of $86,000, a discount of roughly 18%.

The $430,000 Target and How It Is Derived

The analysis pairs the 2-year moving average with a separate red line representing historical cycle tops. That upper band currently sits near $430,000. The framework treats Bitcoin’s price as oscillating between the green accumulation zone below the 2-year moving average and the red distribution zone at the cycle top indicator. From $70,000 to $430,000 represents a 6.1x return.

That target requires examination. The $430,000 figure extrapolates from the same logarithmic growth curve that has produced diminishing returns across successive cycles. Cycle 1 produced a 12,000% return from bottom to top. Cycle 2 produced roughly 2,100%. Cycle 3 roughly 715%. Each successive cycle top delivered a smaller multiple from the cycle bottom. A 6.1x move from current levels would be consistent with that declining but still substantial return pattern.

It would also require Bitcoin to reach a price level it has never approached, in a macro environment where oil is above $100, global equities are under pressure, and institutional flows, while recently positive, reversed sharply twice in the past week.

Swiss Crypto Bank Just Became the First Regulated Bank Inside the EU’s Blockchain Trading System

What the Historical Pattern Cannot Guarantee

Every previous breach of the 2-year moving average occurred in a market where Bitcoin had fewer institutional holders, less ETF exposure, and lower correlation with traditional macro conditions. The asset that broke below $162 in 2015 and the asset trading at $70,000 in 2026 are different instruments in terms of ownership structure, liquidity, and macro sensitivity.

The pattern is real. Thirteen years of data supporting a single indicator is more evidence than most technical signals carry. It is also thirteen years of a market that has changed structurally with each cycle.

Whether $70,000 is the accumulation zone of Cycle 5 or a level with further to fall before the actual bottom depends on conditions the 2-year moving average does not measure: macro liquidity, institutional demand sustainability, and whether the current geopolitical stress extends or resolves.

The indicator says accumulate. The macro environment says proceed carefully. Both things are true at the same time.

The post Bitcoin Just Broke Below Its 2-Year Moving Average: Level That Has Marked Every Major Cycle Bottom appeared first on ETHNews.

Opportunità di mercato
Logo Major
Valore Major (MAJOR)
$0.06304
$0.06304$0.06304
-0.95%
USD
Grafico dei prezzi in tempo reale di Major (MAJOR)
Disclaimer: gli articoli ripubblicati su questo sito provengono da piattaforme pubbliche e sono forniti esclusivamente a scopo informativo. Non riflettono necessariamente le opinioni di MEXC. Tutti i diritti rimangono agli autori originali. Se ritieni che un contenuto violi i diritti di terze parti, contatta [email protected] per la rimozione. MEXC non fornisce alcuna garanzia in merito all'accuratezza, completezza o tempestività del contenuto e non è responsabile per eventuali azioni intraprese sulla base delle informazioni fornite. Il contenuto non costituisce consulenza finanziaria, legale o professionale di altro tipo, né deve essere considerato una raccomandazione o un'approvazione da parte di MEXC.

Potrebbe anche piacerti

USD/CAD Consolidation Holds with Firm Support – Scotiabank’s Crucial Analysis

USD/CAD Consolidation Holds with Firm Support – Scotiabank’s Crucial Analysis

BitcoinWorld USD/CAD Consolidation Holds with Firm Support – Scotiabank’s Crucial Analysis The USD/CAD currency pair continues to exhibit a phase of consolidation
Condividi
bitcoinworld2026/03/11 01:55
Shiba Inu Price Forecast: Why This New Trending Meme Coin Is Being Dubbed The New PEPE After Record Presale

Shiba Inu Price Forecast: Why This New Trending Meme Coin Is Being Dubbed The New PEPE After Record Presale

While Shiba Inu (SHIB) continues to build its ecosystem and PEPE holds onto its viral roots, a new contender, Layer […] The post Shiba Inu Price Forecast: Why This New Trending Meme Coin Is Being Dubbed The New PEPE After Record Presale appeared first on Coindoo.
Condividi
Coindoo2025/09/18 01:13
ASIC Grants Stablecoin Distributors Regulatory Exemption in Australia

ASIC Grants Stablecoin Distributors Regulatory Exemption in Australia

The post ASIC Grants Stablecoin Distributors Regulatory Exemption in Australia appeared on BitcoinEthereumNews.com. Key Points:ASIC grants class relief for stablecoin intermediaries.Streamlines regulatory compliance for industry intermediaries.Potential for increased institutional stablecoin activity. The Australian Securities and Investments Commission (ASIC) granted a regulatory exemption on September 18 for stablecoin intermediaries, allowing distribution without separate financial services licenses within Australia. This exemption provides regulatory clarity, reducing compliance costs, and potentially increasing institutional stablecoin activity under AFS-licensed issuers, signaling upcoming broader reforms in Australia’s digital asset space. ASIC Exempts Stablecoin Providers from Additional Licensing ASIC has provided class exemption for stablecoin intermediaries, allowing them to distribute cryptocurrencies issued by licensed Australian institutions without needing separate financial services licenses. This measure helps address Australia’s regulatory challenges in the stablecoin sector. Intermediaries can now distribute stablecoins through licensed channels without additional AFS licenses, lowering operational barriers. The relief maintains issuer liability while mandating product disclosure to ensure transparency in the market. “The first-of-its-kind relief exempts intermediaries from the requirement to hold separate AFS, Australian market, or clearing and settlement facility licences when providing services related to stablecoins issued by an AFS licensee.” — ASIC Official Statement, Australian Securities and Investments CommissionBlockchain APAC CEO Steve Vallas described this move as a temporary transition toward broader reforms. Official reports emphasize that the exemption does not alter stablecoin classification as financial products. Potential Market Reforms and Global Impact Did you know? Australia’s decision marks its first major regulatory shift to boost stablecoin market efficiency while retaining oversight on financial offerings. Ethereum (ETH) is trading at $4,590.38, with a market cap of formatNumber(554077831078, 2) and 13.53% market dominance. Recent data from CoinMarketCap indicates a 2.25% price increase in 24 hours and an 82.78% rise over the past 90 days. Ethereum(ETH), daily chart, screenshot on CoinMarketCap at 05:36 UTC on September 18, 2025. Source: CoinMarketCap The Coincu research team posits that this exemption may…
Condividi
BitcoinEthereumNews2025/09/18 14:25