

Bitcoin (BTC) Price Analysis: Potential Bottom Zones After 43% Decline From Peak
Key Takeaways
- Historical Bitcoin bear markets have witnessed declines ranging from 77% to 85% from their peaks; applying similar metrics to the 2025 high of $126,198 suggests potential lows between $19,000 and $29,000.
- Market experts believe the current downturn resembles a mid-cycle correction rather than the beginning of a prolonged bear market phase.
- The primary support zone is projected between $58,000 and $68,000, though a more aggressive selloff could push prices down to $48,000–$58,000.
- Historical cycle analysis suggests Bitcoin typically reaches its trough approximately 12–13 months following peak valuations, indicating a potential October–November 2026 timeframe — though current technical indicators don’t strongly validate this projection.
- Confirmation signals for a genuine bottom include robust weekly candle closes, successful reclamation of resistance zones, and bullish reversal in weekly RSI readings.
On October 6, 2025, Bitcoin reached its record peak of $126,198, as tracked by CoinGlass data. The cryptocurrency has since retreated to approximately $71,000, prompting the perennial market question: are we witnessing a standard pullback or the onset of a deeper bear phase?
Looking at previous cycles provides valuable perspective. Bitcoin experienced an 85% crash from its 2013 top, an 84% plunge from its 2017 summit, and a 77% drawdown from its 2021 high. Applying comparable percentage drops to the $126,198 peak would theoretically bring Bitcoin down to a range of $19,000 to $29,000 under worst-case conditions.
However, weekly chart technicals indicate this cycle might deviate from that trajectory. The long-term ascending channel structure remains unbroken. The present price action appears more consistent with a rejection near the upper boundary of this formation rather than a complete structural collapse into multi-year bearish territory.
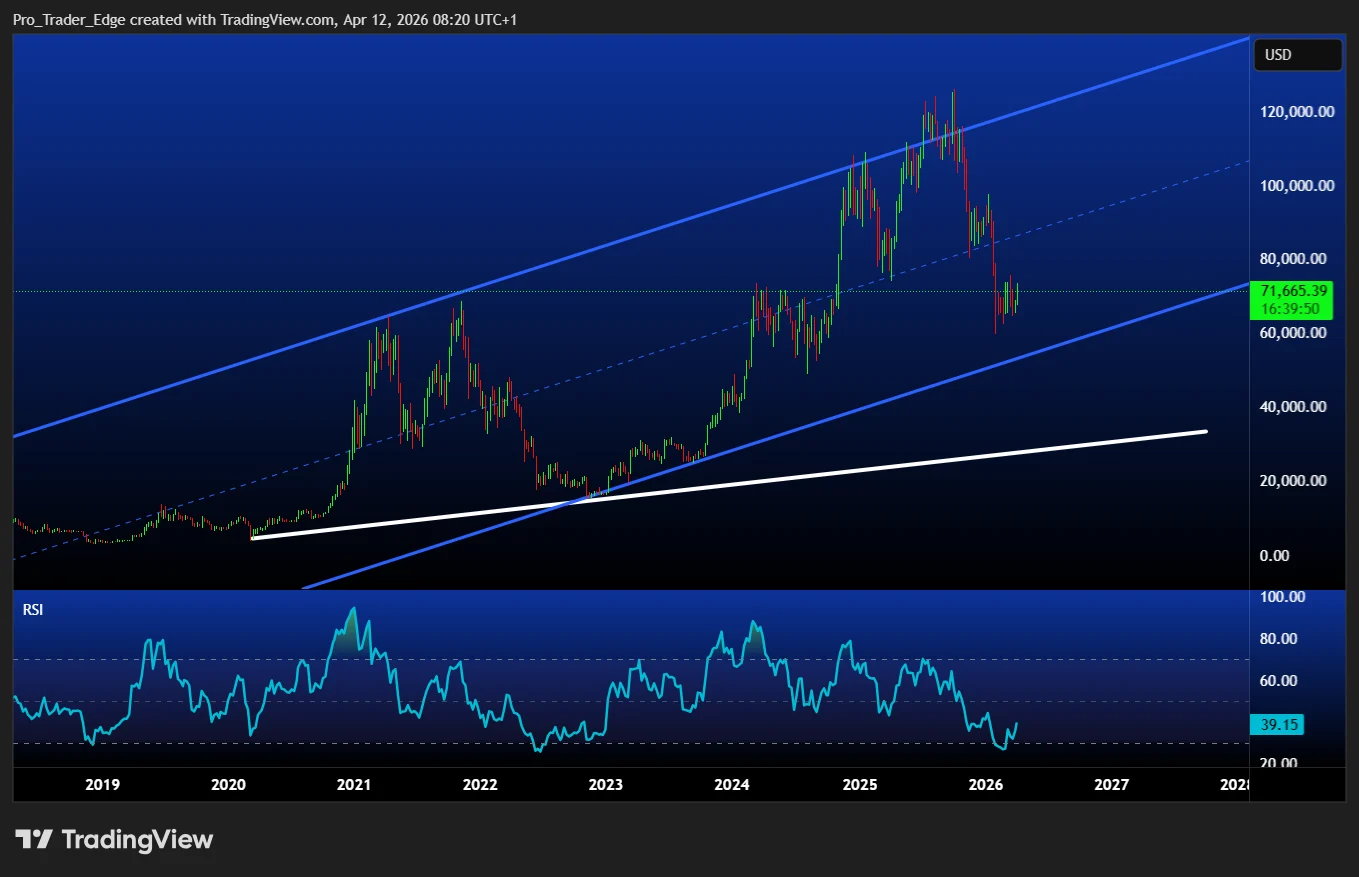 Source: TradingView
Nevertheless, market analysts don’t consider the bottom to be established yet. The weekly RSI indicator continues showing weakness without signs of momentum reversal. The market structure appears compromised but hasn’t reached complete capitulation levels.
Projected Support Zones
Based on current chart structure, the most probable support area sits between $58,000 and $68,000. This range would constitute approximately a 46% to 54% retracement from the October 2025 all-time high.
A more severe capitulation scenario could drive prices into the $48,000 to $58,000 territory — representing a 54% to 62% correction. While both outcomes would be substantial, they remain considerably less severe than the 80%-plus collapses witnessed in previous bear cycles.
There’s also a bullish alternative scenario. Should demand resurge rapidly, a shallower bottom formation between $68,000 and $74,000 remains within the realm of possibility.
Historical cycle patterns show Bitcoin typically establishes its bottom roughly 12 to 13 months following the preceding cycle peak. Extrapolating this timeline from the October 2025 high suggests a potential low forming around October to November 2026 if that truly marked the cycle culmination.
Current Technical Picture
That said, present chart characteristics don’t strongly resemble a completed parabolic blow-off followed by total collapse. The structure appears more aligned with a significant retracement within an overarching uptrend that maintains its integrity.
If this interpretation proves accurate, the bottom formation may materialize within weeks to several months rather than extending into late 2026.
Technical confirmation indicators that would validate a genuine bottom include strong weekly candle closes, successful recapture of nearby resistance thresholds, and upward inflection in weekly RSI momentum. Currently, none of these confirmation signals have materialized.
Bitcoin trading at $71,000 offers better value relative to recent highs, but analysts haven’t identified a clear, high-probability bottom formation at this juncture.
Conclusion
Traders and investors searching for a market bottom should approach this using price zones rather than precise single targets. The optimistic scenario points to a shallow low around $68,000–$74,000. The baseline expectation centers on $58,000–$68,000. Should prices breach below $48,000, the market dynamics would begin resembling a genuine bear market rather than a cyclical correction phase.
The post Bitcoin (BTC) Price Analysis: Potential Bottom Zones After 43% Decline From Peak appeared first on Blockonomi.


추천 콘텐츠

Latam Insights: JPMorgan’s JPM Coin Pilot, Compliance Advances – Crypto News Bitcoin News

Bitcoin is Predicted to Reach $74,260 By Apr 07, 2026


