

Solana Price at Risk as Key Network Metrics Wane and ETF Inflows Lag
Key Insights
- Solana price has formed a bearish flag pattern on the three-day chart.
- The spot Solana ETFs have added just $30 million this month.
- Key metrics like DeFi TVL and network fees have dropped recently.
Solana price has moved sideways in the past few weeks as the crypto winter has continued. SOL token was trading at $84 on Monday, down from last year’s high of nearly $300. This consolidation may lead to a crash to $50 as key network metrics wane and ETF inflows point to weak demand.
Solana Price Technical Analysis Points to a Crash
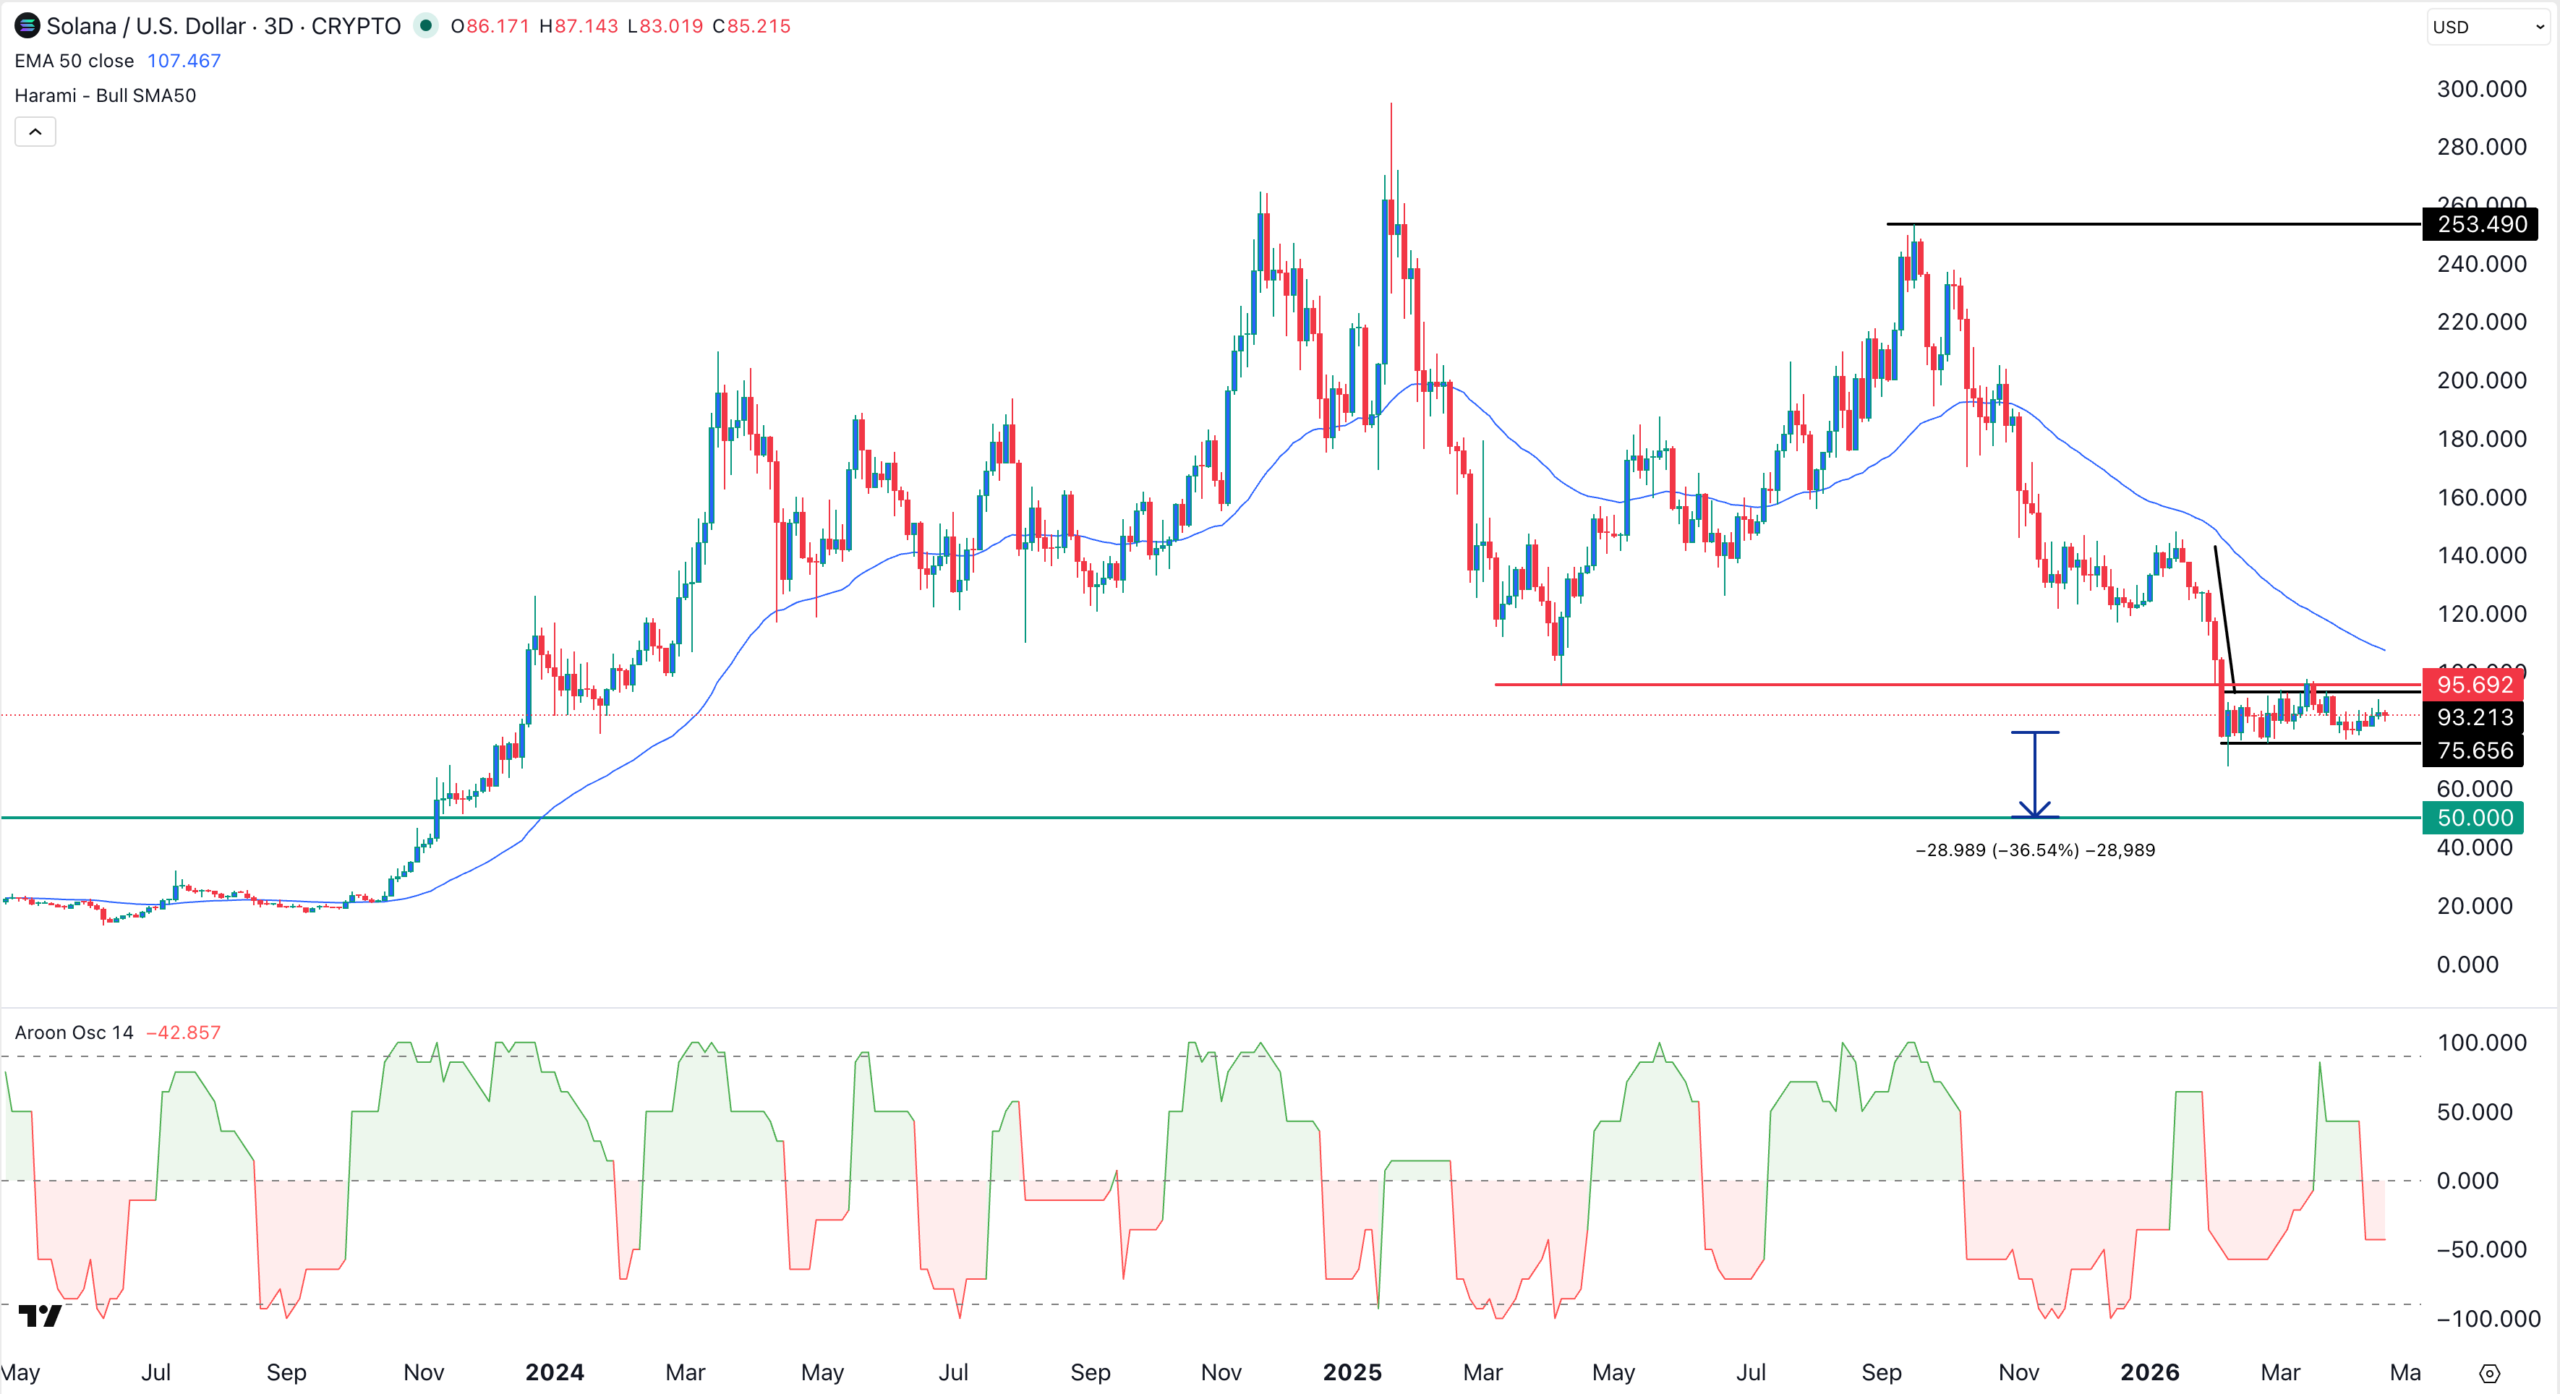
The three-day chart shows that the SOL token has been in a freefall since September last year when it peaked at $254. Most recently, the token has moved sideways, a sign that it has formed a bearish flag pattern.
This pattern is made up of two parts: a flagpole and a flag. In this case, the flagpole happened between January and February 6, while the flag section has been forming since then. In most periods, this pattern normally leads to a strong bearish breakdown.
The target price is estimated by subtracting the lower side of the flag from its upper side, and then measuring the same distance from the flag’s lower side.
Meanwhile, Solana price has remained below the important support level at $95.70, its lowest level on April 10, and the neckline of the double-top pattern.
 BTC/USD 1-day price chart. source: TradingView
It has remained below the 50-day and 100-day Exponential Moving Averages (EMA) and the Supertrend indicator, a sign that bears remain in control. Also, the Aroon Oscillator has dropped and moved below the zero line.
Therefore, these patterns indicate that the token will likely continue to fall in the near term. A bearish breakdown will be confirmed when it moves below the lower side of the channel at $75. A drop below that price will point to more downside, potentially to the psychological level of $50.
Solana price chart | Source: TradingView
Spot SOL ETFs are Seeing Weaker Demand
Third-party data shows that demand for the spot Solana ETFs is much weaker than for other top coins. These funds have added $30 million this month, bringing the cumulative total inflows to $1.01 billion. They have never had a month in the red
Spot Bitcoin ETFs, on the other hand, added $1.62 billion this month, bringing total inflows to $57.7 billion. They now hold $101 billion in assets. Similarly, spot Ethereum and XRP ETFs have added $384 million and $65 million.
As such, the fading momentum is a sign that investors are concerned about Solana’s growth trajectory.
Key Solana Metrics Has Deteriorated Recently
Indeed, some of the most important metrics in the network have deteriorated in the past few months. For example, the total value locked (TVL) in Solana’s ecosystem has plunged from $13 billion in November last year to $5.5 billion today.
The TVL crash has accelerated this month as crypto hacks soared. Earlier this month, hackers drained over $270 million in assets from Drift Protocol, the biggest perpetual DEX network on Solana.
In the latest hack, North Korean hackers stole over $200 million from KelpDAO by exploiting vulnerabilities in LayerZero. As a result, some users have begun withdrawing their funds from DeFi protocols on Solana and other networks.
More data shows that the DEX volume on Solana has continued to fall. It handled $57 billion in volume last month, the lowest level in months.
It was down sharply from last year’s high of $303 billion. This slowdown is likely because more crypto traders are focusing on Hyperliquid, which handles billions of dollars in daily volume.
 Solana DEX volume chart | Source: DeFi Llama
Consequently, Solana is making less money in fees this year than it made in the previous one. It generated $18 million in fees last month, down from $241 million in January last year.
In summary, the Solana price has formed bearish technicals, including a bearish flag pattern. It remains below all moving averages, while its fundamentals have continued to deteriorate. This combination points to a strong bearish breakout in the near term.
The post Solana Price at Risk as Key Network Metrics Wane and ETF Inflows Lag appeared first on The Market Periodical.


추천 콘텐츠

Real Prize Casino: Exciting Online Games

Signs of Hope Emerge for Ethereum’s Market Trajectory


