

Solana Eyes Historic Rally as Fibonacci Level Points Toward 1200 Target
Solana trades near $94, with $113 resistance in focus as Fibonacci analysis points toward a possible $1,200 target.
Analysts are watching Solana as it nears a possible return to the 0.5 Fibonacci level. The chart shows this zone has acted as an important area in past cycles.
Some market analysts say another retest could support a larger move, with the long-term Solana price target near $1,200 now part of the discussion.
Solana Price Trades Below Key Fibonacci Resistance
Solana is trading near $94.36 on the daily chart after a sharp pullback from higher levels.
The asset has moved below the 1.0 Fibonacci level near $113.03. That level now acts as a key resistance area for any recovery attempt.
The chart also shows Solana below several major Fibonacci retracement levels. These levels stand near $139.20, $159.75, $174.18, $188.61, and $206.47.
A move above $113 would be the first step toward a stronger technical setup.
analysts are watching whether Solana can regain the lost support area. A daily close above $113 may show that buyers are returning.
Until that happens, the price structure remains under pressure.
Fibonacci Level Keeps 1200 Target in Focus
The current Solana technical analysis centers on the 0.5 Fibonacci level.
According to the chart setup, Solana has touched this level seven times on the weekly chart. A fresh retest could bring renewed focus to a larger breakout pattern.
The bullish market view points to a possible move toward $1,200 if the pattern repeats.
This target is based on the idea that Solana has often moved strongly after testing major Fibonacci zones. However, price must first recover key resistance levels.
The $113 zone remains the near-term level to watch. Above that, the next resistance levels are $139 and $159.
A move through those areas could improve the Solana price forecast and bring the 0.5 Fibonacci level back into focus.
Data from CoinMarketCap shows Solana trading at $94.72, up 2.12% over 24 hours. Its market cap stands at $54.7 billion, while daily volume is $3.41 billion.
The 24-hour volume is down 28.56%, showing weaker trading activity during the price rise. Solana’s circulating supply is 577.56 million SOL, with total supply at 626.09 million SOL.
Read Also:
RSI and MACD Show Early Recovery Signs
Momentum indicators show early signs of recovery on the daily chart. The RSI is moving higher, with the faster line near 69.68.
The signal line is near 53.62, which places momentum in a more stable range. This reading shows that buying pressure has improved from weaker levels.
Yet the market still needs confirmation from price action. A stronger signal would come if Solana reclaims $113 while RSI holds above the midrange.
The MACD also shows a positive turn. The MACD line is above the signal line, and the histogram shows early bullish momentum.
This supports a short-term recovery case, but follow-through remains important.
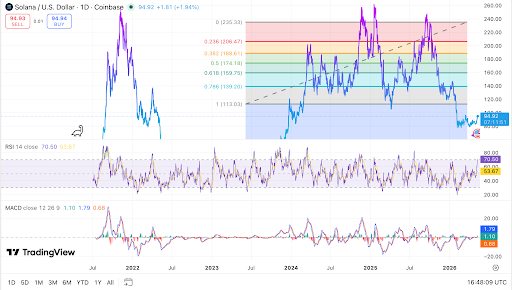 SOL tests key Fibonacci levels as momentum indicators recover: source TradingView.
Solana support sits near the $80 to $90 range. The market is trying to hold this area after the recent decline. A break below this zone could open further downside.
Solana remains at a key technical point. Bulls need to reclaim $113 before a wider recovery can develop.
The $1,200 target remains tied to a successful Fibonacci retest and stronger market structure.
The post Solana Eyes Historic Rally as Fibonacci Level Points Toward 1200 Target appeared first on Live Bitcoin News.


추천 콘텐츠
Real Integrates iExec to Advance Privacy-Focused RWA Infrastructure

BNB slips below $590 as Trump threatens to strike Iranian power plants

Bitcoin Miners Warn No Bottom Yet, CryptoQuant Says—What On-Chain Metrics Reveal


인기 뉴스
더보기
