

Alphabet Stock stays bullish as overbought signals raise pullback risk

Alphabet Stock remains in a strong bullish structure, but the setup now looks increasingly crowded as momentum stays positive while overbought conditions raise the risk of a sharper pullback.
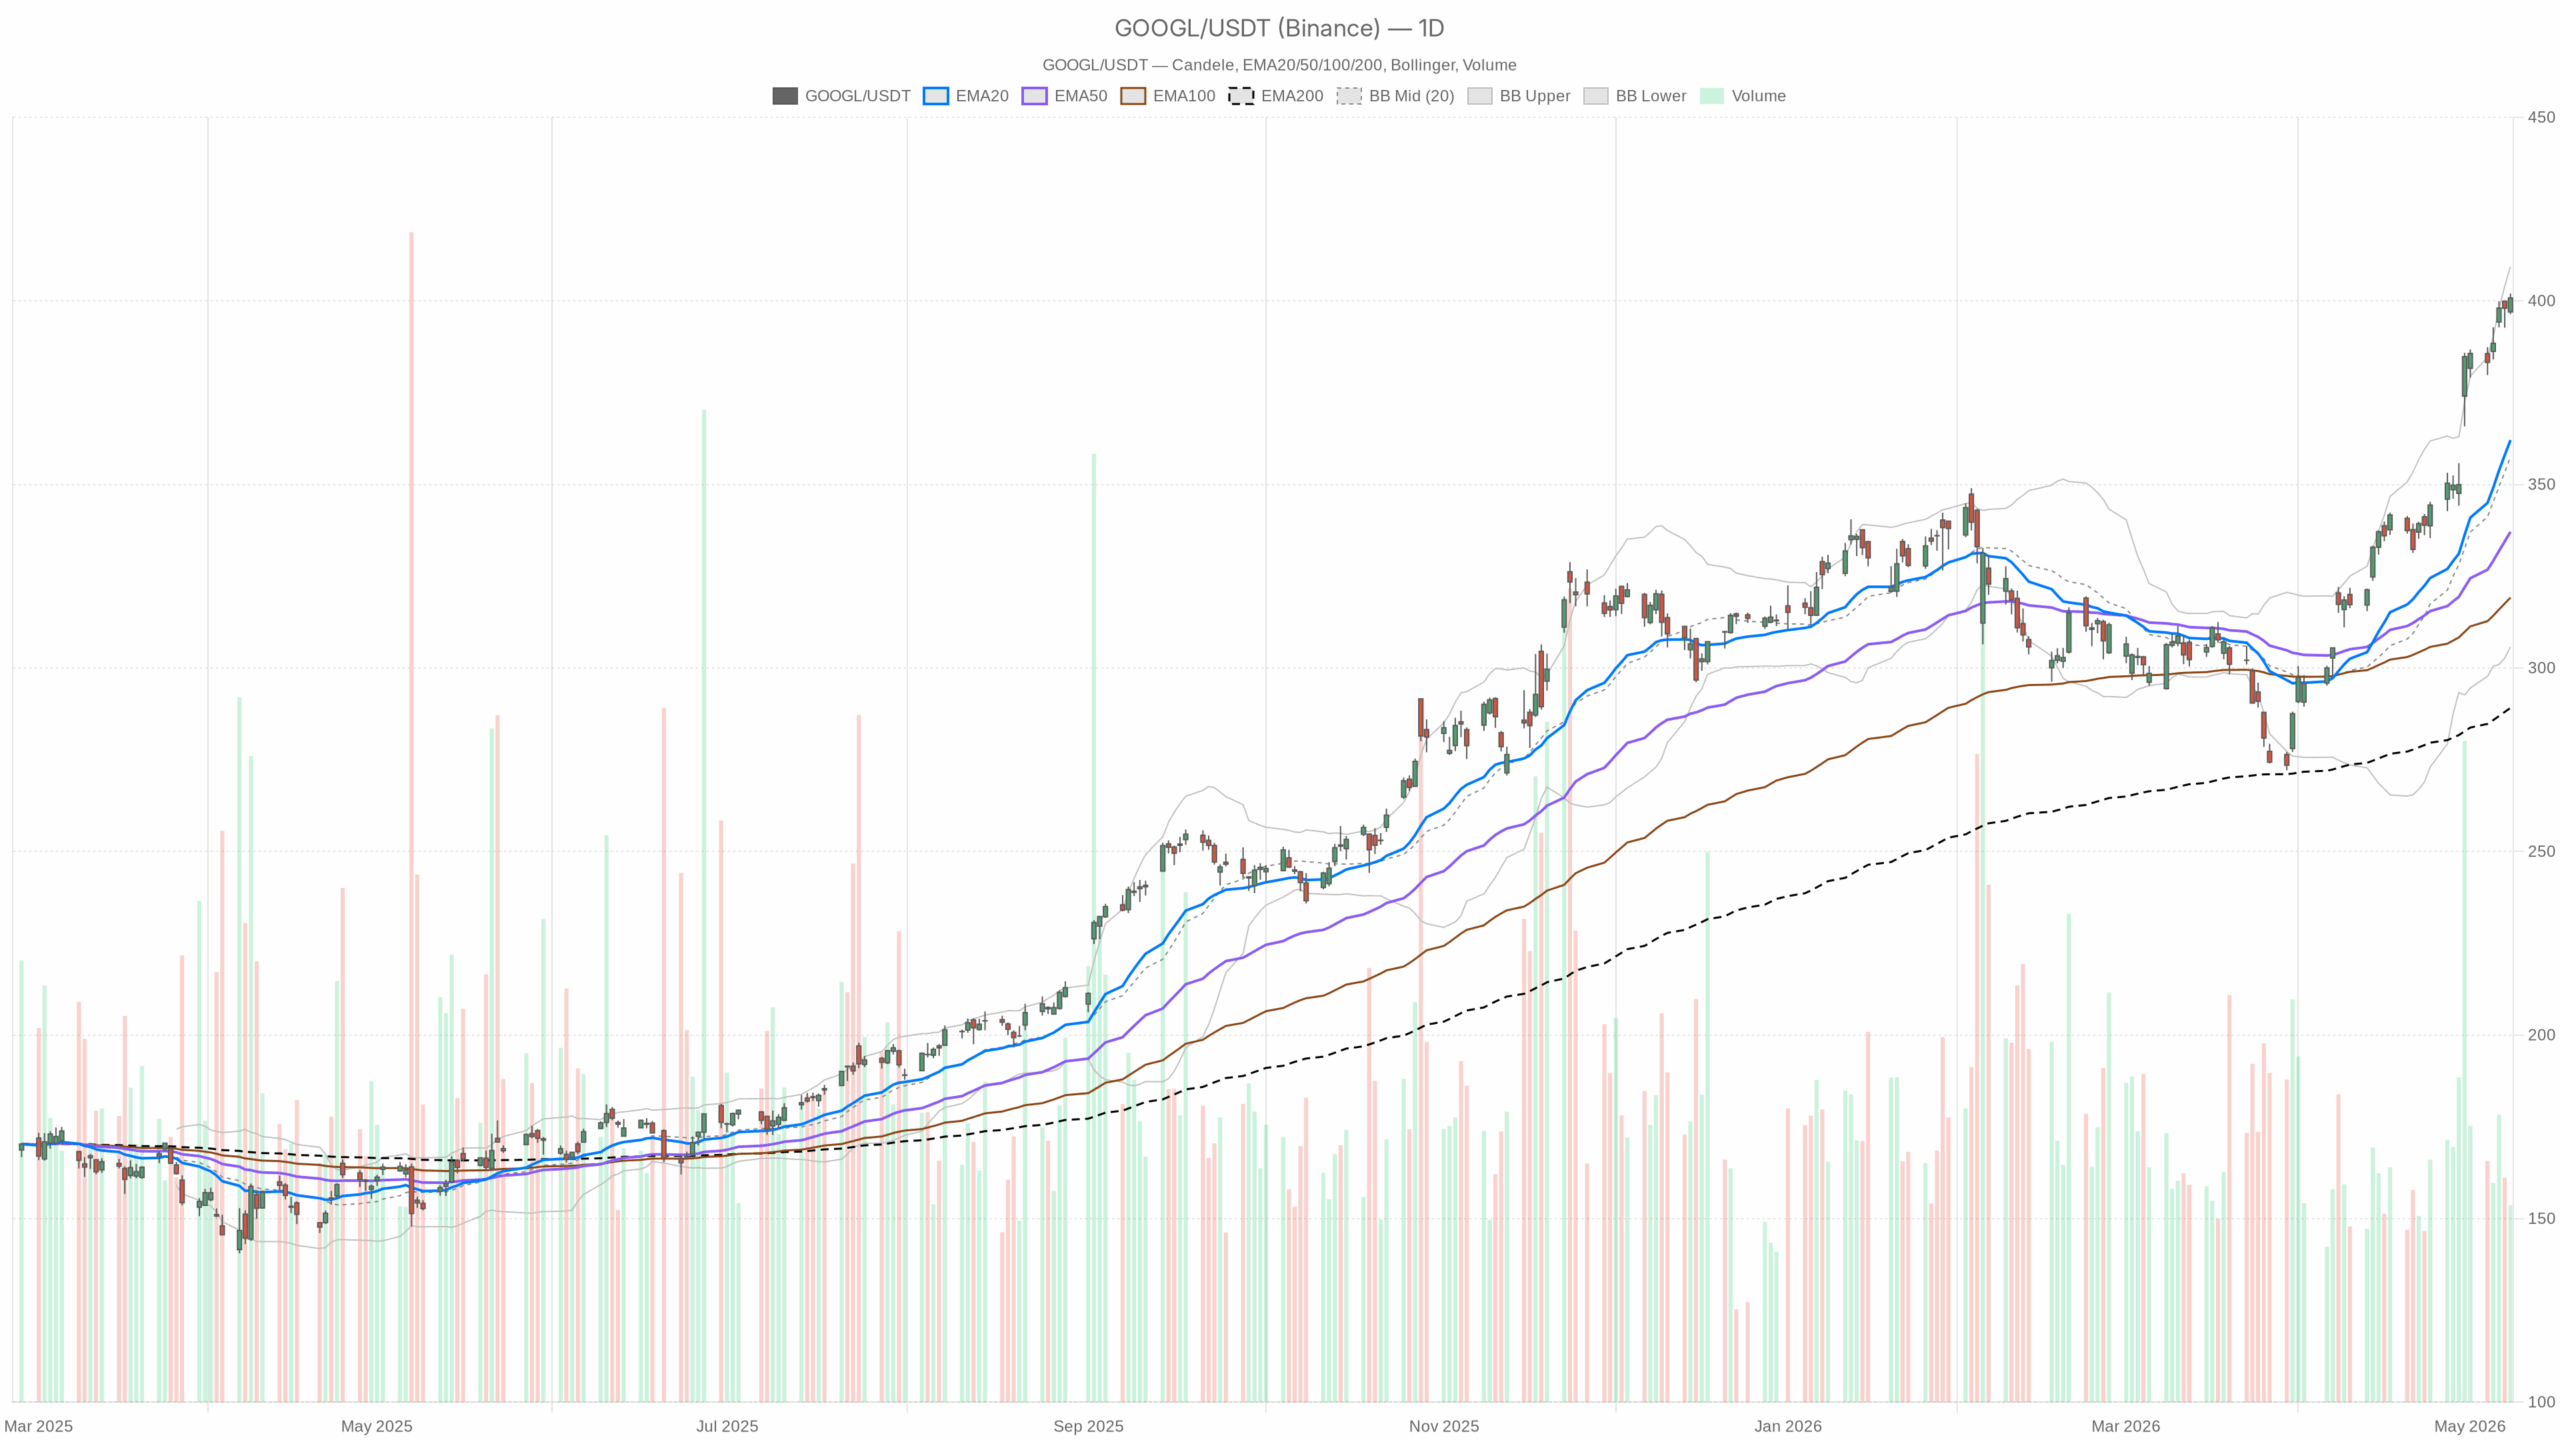 GOOGL — daily chart with candlesticks, EMA20/EMA50 and volume.
Alphabet Stock trend remains firmly bullish
Alphabet Stock remains in a strong bullish structure on the daily chart, and that has to stay the starting point. Price closed at 400.8, well above the 20-day EMA at 362.06, the 50-day EMA at 337.07, and the 200-day EMA at 289.13. That alignment confirms a powerful trend across short-, medium-, and long-term horizons. In plain terms, buyers still control the broader move and the market is paying up for momentum.
At the same time, this is no longer an early-stage breakout. The daily RSI stands at 84.03, which is deeply stretched. That does not reverse a trend on its own. However, it does show the advance is crowded and vulnerable to sharper pullbacks. Meanwhile, daily MACD remains positive, with the line at 22.18 above the signal at 17.78 and the histogram at 4.4. Momentum is still rising, so the uptrend remains intact even as conditions look overheated.
Volatility is expanding near the top of the range
Notably, Alphabet is trading near the upper Bollinger Band on the daily timeframe, with the upper band at 409.32 against a close of 400.8. That tells us price is pressing the top end of its recent volatility envelope rather than relaxing back toward the mean. ATR at 10.34 also shows that daily trading ranges are meaningful. In practice, the stock can stay bullish while still producing wide swings that shake out late entries.
Hourly Alphabet Stock signals are still constructive, but softer
The hourly chart broadly confirms the daily bias, but it also introduces the first real note of caution. Price at 400.81 still sits above the 20-hour EMA at 396.31, the 50-hour EMA at 386.38, and the 200-hour EMA at 350.63. Trend structure remains constructive on this timeframe as well. However, the hourly MACD is softer, with the line at 3.62 below the signal at 4.08 and a negative histogram of -0.46. That points to fading short-term momentum inside a still-bullish larger trend.
In addition, the hourly RSI at 68.33 is firm but no longer as extreme as the daily reading. That combination matters. It suggests the market is not breaking down, but it may be entering a pause or consolidation phase after a steep run. The hourly Bollinger Band upper level sits at 401, almost exactly where price closed. That shows Alphabet is pressing resistance at the edge of its short-term range rather than cleanly expanding away from it.
Intraday execution context points to near-term extension
The 15-minute chart is useful mainly for execution context, and it leans mildly bullish. Price remains above the 20-period EMA at 398.97, the 50-period EMA at 397.63, and the 200-period EMA at 385.2. Near-term control still belongs to buyers. Moreover, 15-minute MACD is positive and RSI at 66.83 shows momentum is holding up intraday, even if it is not at runaway levels.
However, the 15-minute Bollinger upper band is 400.63, slightly below the latest close at 400.81, and the 15-minute pivot point is 401.11. That tells us the stock is pushing into a tight short-term extension area. Intraday traders are chasing strength near resistance, not buying a reset. ATR at 0.9 on this timeframe implies the immediate move can still shift quickly, but within a comparatively narrow execution band.
Pivot levels show Alphabet Stock near a decision zone
Pivot levels reinforce how compressed the stock is around a decision zone. On the daily chart, the pivot point is 399.72, with resistance at 403.08 and support at 397.44. Price is sitting just above that central level, which keeps the broader bias constructive. On the hourly chart, the pivot at 400.7 is almost exactly in line with the latest price, while resistance stands at 402.11 and support at 399.39. In other words, Alphabet is balanced near short-term inflection levels rather than trading with clean immediate separation.
AI narrative supports the rally, but optimism is already elevated
News flow helps explain why the trend has stayed so strong. Recent coverage has centered on Alphabet’s AI positioning, TPU sales, Gemini, cloud share gains, and investor willingness to re-rate the company as an AI winner. There is also evidence of large-scale funding activity tied to AI investment. Even so, some commentary has started to warn that the AI rally may be getting ahead of itself. That fits the chart well: the fundamental narrative remains supportive, but the price action already reflects a great deal of optimism.
Alphabet Stock outlook: bullish bias with rising pullback risk
Therefore, the main scenario remains bullish, but with elevated pullback risk. The daily chart still argues for trend continuation as long as Alphabet holds above nearby support and avoids losing its higher-timeframe structure. A push through the 402 to 403 area would strengthen the case for another extension, especially if hourly momentum turns back up and price starts holding above the upper end of the recent range instead of merely tagging it.
On the other hand, the bearish scenario is not a trend reversal call yet. It is a warning that stretched daily momentum, weakening hourly MACD, and repeated tests of upper Bollinger resistance can lead to a cooling phase. If Alphabet fails to hold the 399.72 daily pivot and slips below 397.44 support, the bullish case starts to weaken. A broader loss of the hourly 20-EMA near 396.31 would add to that pressure and suggest the stock is moving from breakout behavior into retracement.
Overall, Alphabet Stock still trades like a strong leader, and the daily timeframe clearly keeps the bias positive. Still, the lower timeframes show that momentum is no longer accelerating cleanly. Positioning here is less about identifying the dominant trend and more about judging whether buyers can absorb an overbought tape without a deeper reset. Volatility remains high enough to matter, and that keeps short-term uncertainty elevated even within a bullish broader structure.


추천 콘텐츠

Why Ethereum Took a Bigger Hit Than Bitcoin After Trump’s Iran “Stone Ages” Speech

Trump Crypto Manipulation: Explosive Claims of Daily Bitcoin Market Influence Through Geopolitical Statements

EUR/JPY Stalls: Critical 184.00 Level Holds as Markets Decipher ECB and BoJ Policy Signals


인기 뉴스
더보기
