

GBP/USD Price Forecast: Buyers Hold Control Above Key 200-Day SMA Level
BitcoinWorld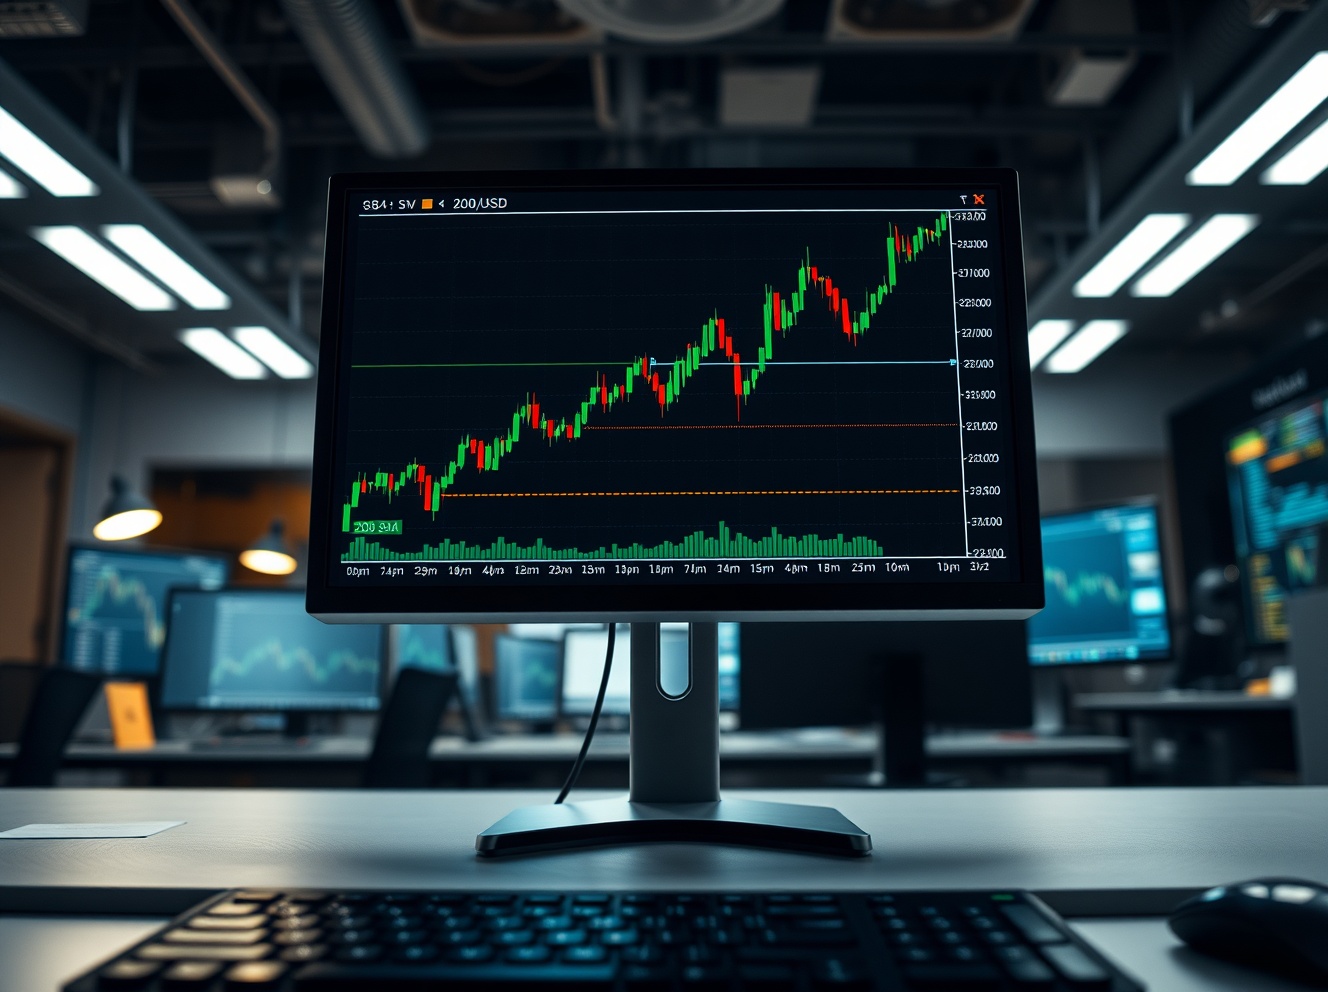
GBP/USD Price Forecast: Buyers Hold Control Above Key 200-Day SMA Level
The British pound has maintained a bullish posture against the US dollar, with the GBP/USD currency pair holding decisively above the widely watched 200-day simple moving average (SMA). This technical milestone signals that buyers remain in control of the near-term trend, even as broader macroeconomic factors continue to influence market sentiment.
Technical Setup: Why the 200-Day SMA Matters
The 200-day SMA is a critical long-term trend indicator used by traders and institutional investors to gauge the overall direction of an asset. When a currency pair trades above this moving average, it typically suggests that the prevailing trend is bullish. For GBP/USD, the sustained position above this level has reinforced confidence among buyers, with the pair recently testing resistance near the 1.2700 region.
From a technical perspective, the 200-day SMA now acts as a dynamic support floor. Should the pair pull back, traders will closely watch this level for a potential bounce. A decisive break below the 200-day SMA could shift the bias to neutral or bearish, but current price action suggests buyers are defending this line with conviction.
Fundamental Drivers Supporting Sterling
The pound’s resilience comes amid a complex backdrop. The Bank of England has maintained a cautious stance on interest rates, with markets pricing in a slower pace of rate cuts compared to earlier expectations. This relative monetary policy divergence has supported the pound against the dollar, especially as the Federal Reserve signals a more accommodative path.
Additionally, improving UK economic data, including stronger-than-expected GDP figures and easing inflation pressures, has bolstered confidence in the British economy. These factors have encouraged capital inflows into sterling-denominated assets, further underpinning the currency.
Key Levels to Watch
For traders monitoring the GBP/USD pair, the following levels are critical:
- Resistance: 1.2750 and 1.2800 – A break above these levels could open the door to a test of the 1.3000 psychological barrier.
- Support: The 200-day SMA near 1.2550, followed by the 50-day SMA around 1.2450. A close below these levels would signal a loss of bullish momentum.
The pair’s ability to hold above the 200-day SMA will be a key litmus test for the sustainability of the current rally. Traders should also watch for any unexpected shifts in US economic data or Federal Reserve commentary that could alter the dollar’s trajectory.
Conclusion
The GBP/USD pair remains in a technically constructive position, with buyers retaining control above the 200-day SMA. While the near-term outlook is bullish, traders should remain vigilant for potential volatility triggers, including central bank statements and geopolitical developments. The 200-day SMA will continue to serve as a pivotal reference point for the pair’s directional bias in the sessions ahead.
FAQs
Q1: What does it mean when GBP/USD trades above the 200-day SMA?
A1: It generally indicates a bullish long-term trend. Traders view the 200-day SMA as a key support level, and price action above it suggests buyers are in control.
Q2: What could cause GBP/USD to break below the 200-day SMA?
A2: A break below could be triggered by unexpected dovish Bank of England policy, stronger US economic data, or a risk-off sentiment shift that boosts the US dollar as a safe haven.
Q3: Is the 200-day SMA a reliable indicator for short-term trading?
A3: It is primarily a long-term trend indicator. While useful for identifying the broader trend, short-term traders often combine it with shorter-term moving averages and oscillators for entry and exit signals.
This post GBP/USD Price Forecast: Buyers Hold Control Above Key 200-Day SMA Level first appeared on BitcoinWorld.


추천 콘텐츠

Real Integrates iExec to Advance Privacy-Focused RWA Infrastructure

BNB slips below $590 as Trump threatens to strike Iranian power plants

Bitcoin Miners Warn No Bottom Yet, CryptoQuant Says—What On-Chain Metrics Reveal


인기 뉴스
더보기
