

Peter Brandt Calls SUI Bottom as Token Surges Out of Long Compression

Veteran trader Peter Brandt flags a major bottom on $SUI as the token surges 46%, with the Sui community pointing to rising momentum and a growing base.
The chart had been coiling for months. Then SUI moved.
On May 10, veteran commodity trader Peter Brandt posted on X calling a major bottom on $SUIUSDT. “This is a major bottom,” Brandt wrote. “Price will trend substantially higher from current levels.” That kind of statement from Brandt who has tracked macro price cycles across decades does not typically get ignored.

Source: Community_Sui
SUI Breaks Out of a Multi-Month Wedge
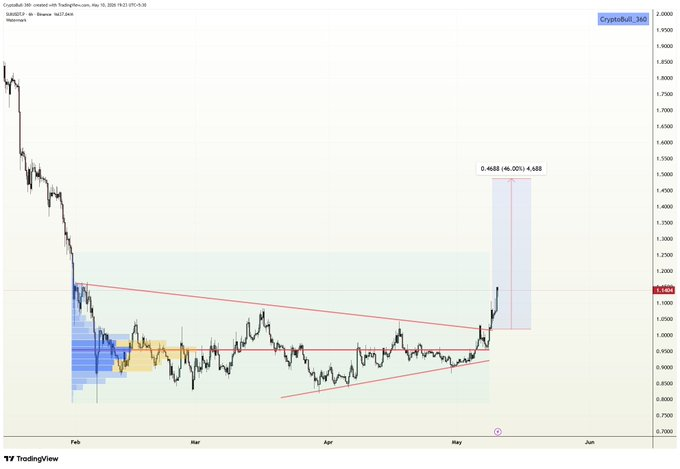
The 6-hour chart attached to the Sui Community’s post on X tells most of the story. Price had been grinding inside a descending wedge structure from February through May, compressing tighter with each failed attempt at recovery. The breakout printed sharply. A measured move projection from the pattern places the next target around 46%, with the chart flagging a 0.4688 gain on the current leg roughly a move from the $0.90 zone toward the $1.35-to-$1.40 range.
Source : Community_Sui
That’s the kind of setup traders call a “spring.” Long compression, then fast exit.
The SUI token had been building a base between $0.90 and $1.20 for weeks before this move. Buyers defended that range repeatedly. The breakout that followed was not gradual.
What the Community Is Saying
The Sui Community account, posting on X, described the token’s performance as “promising,” pointing to a steady rise in value and a growing base of supporters. “We’re excited to see what the future holds,” the account wrote. Measured language from an official community account. But the chart behind that post carried a more aggressive message.
The wedge had been forming since early February. The breakout came in May. That’s roughly three months of compression giving way in a single session.
Brandt’s call landed on the same day the chart broke. Timing like that gets attention.
Key Levels to Watch Now
Resistance near $1.72 remains the first major test, according to prior technical analysis on SUI’s structure. That level acted as support during earlier market cycles before flipping. A clean reclaim of $1.72 on the daily would open the path toward the $2.20-to-$2.30 zone. The levels above that $2.63, $2.91 those come later if volume holds.
RSI had moved into elevated territory following the break. That’s not unusual after a compression exit.
The floor that mattered was the $0.815-to-$0.837 range that defined the lower boundary of the structure. SUI held above it. Price did not revisit that zone before the breakout printed. Brandt apparently saw enough.
Disclaimer: This article is based on publicly available technical analysis and does not constitute financial or investment advice. Price analysis reflects the views of cited sources only.
The post Peter Brandt Calls SUI Bottom as Token Surges Out of Long Compression appeared first on Live Bitcoin News.


추천 콘텐츠

Ethereum Review: Can ETH Hold $2,100 as Mutuum Finance (MUTM) Raises $21M?

IronWallet vs Coinbase Wallet: Two Approaches to Multi-Chain Self-Custody


