

Bitcoin Price Eyes $82K Break, Bulls Prepare For Bigger Rally
Bitcoin price started a downside correction from the $82,000 zone. BTC is consolidating and might aim for a fresh increase if it clears $82,000.
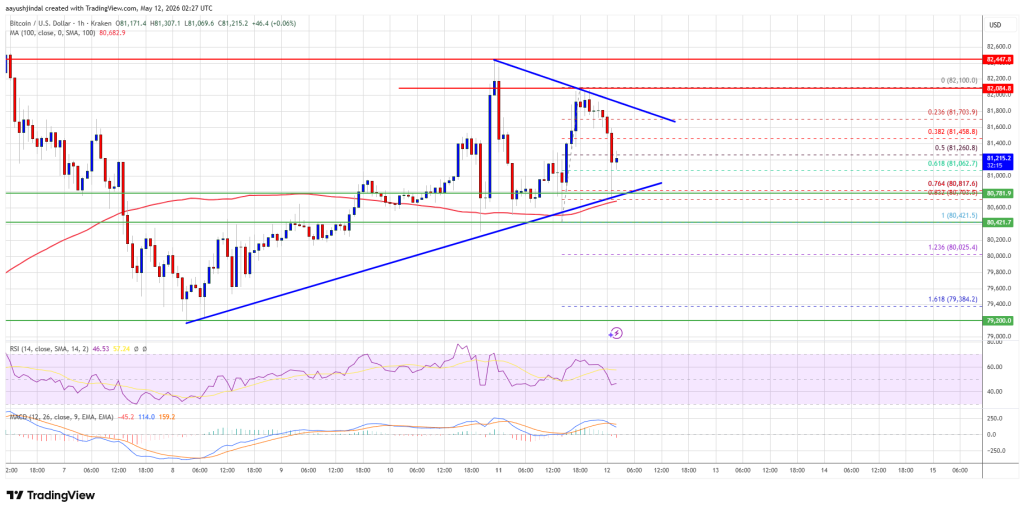
- Bitcoin failed to stay above $81,500 and extended losses.
- The price is trading above $80,500 and the 100 hourly simple moving average.
- There is a key contracting triangle forming with support at $80,800 on the hourly chart of the BTC/USD pair (data feed from Kraken).
- The pair might extend losses if it stays below the $81,800 and $82,000 levels.
Bitcoin Price Dips Again
Bitcoin price failed to clear the $82,000 resistance zone. BTC started a downside correction below the $81,500 and $81,200 levels to enter a short-term bearish zone.
There was a move below the 50% Fib retracement level of the upward move from the $80,421 swing low to the $82,100 high. However, the bulls were active above $80,500. There is also a key contracting triangle forming with support at $80,800 on the hourly chart of the BTC/USD pair.
Bitcoin is now trading above $80,500 and the 100 hourly simple moving average. If the price remains stable above $80,500, it could attempt a fresh increase. Immediate resistance is near the $81,500 level.
The first key resistance is near the $81,800 level. A close above the $81,800 resistance might send the price further higher. In the stated case, the price could rise and test the $82,250 resistance. Any more gains might send the price toward the $82,500 level. The next barrier for the bulls could be $83,500.
Downside Extension In BTC?
If Bitcoin fails to rise above the $81,800 resistance zone, it could start another decline. Immediate support is near the $80,800 level or the 76.4% Fib retracement level of the upward move from the $80,421 swing low to the $82,100 high.
The first major support is near the $80,400 level. The next support is now near the $79,400 zone. Any more losses might send the price toward the $79,000 support in the near term. The main support now sits at $78,500, below which BTC might struggle to recover in the near term.
Technical indicators:
Hourly MACD – The MACD is now gaining pace in the bearish zone.
Hourly RSI (Relative Strength Index) – The RSI for BTC/USD is now below the 50 level.
Major Support Levels – $80,800, followed by $80,400.
Major Resistance Levels – $81,800 and $82,000.


추천 콘텐츠

Beyond Cleaning: What Else You Must Check Before Moving Out

Justice Department has 'gone off the rails' for Trump's 'pretzel logic': analysis


