

Bitcoin (BTC) Price: Historic MVRV Signal Returns, Signaling Potential Major Rally Ahead
TLDR
- A potential MVRV golden cross formation is developing for Bitcoin, matching patterns that triggered previous bull market surges.
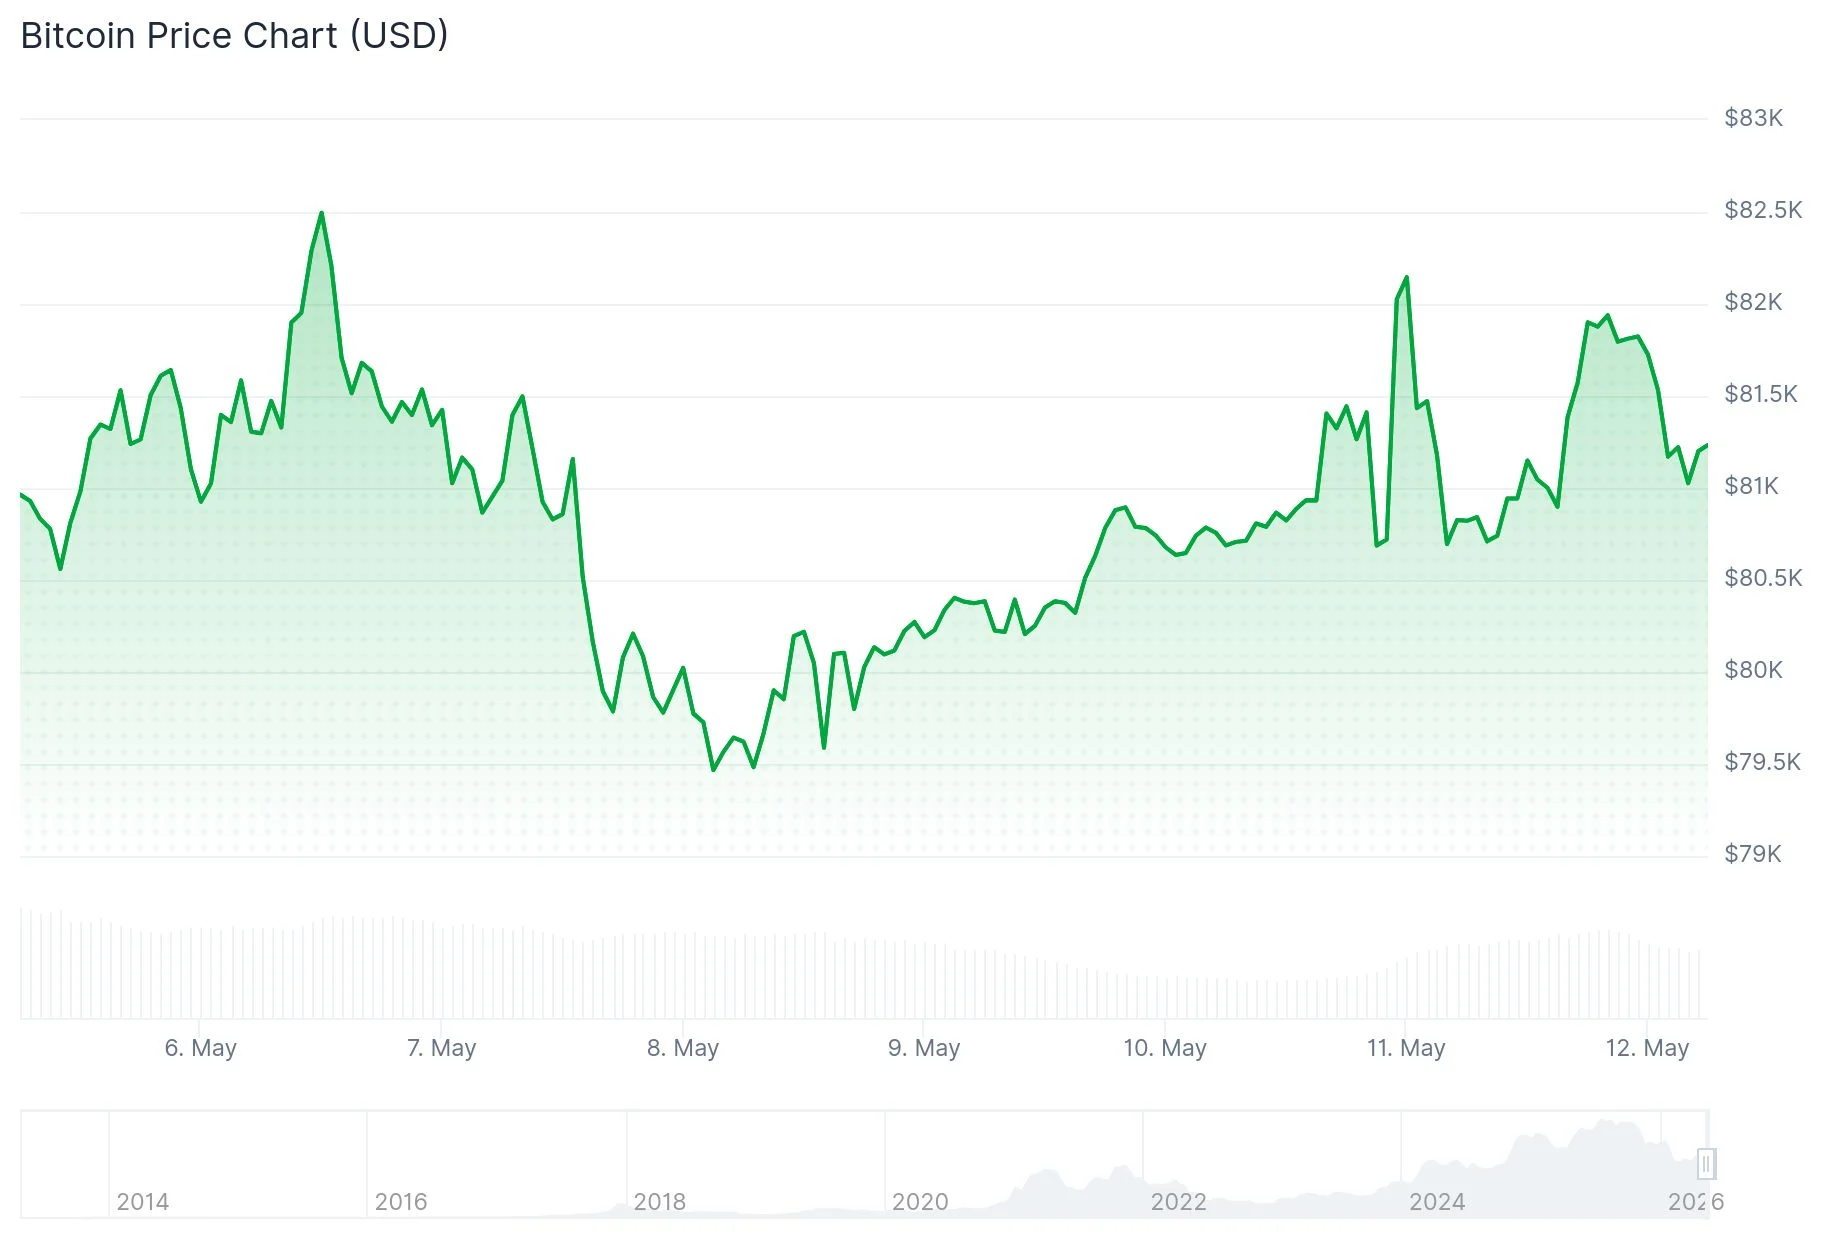
- Bitcoin trades in a consolidation zone between $80,500 and $82,000, approaching critical resistance barriers.
- On-chain data shows the STH cost basis heated zone at $92,000, while the overheated threshold reaches $104,000.
- Market analyst Daan Crypto Trades highlighted a strong weekly close above the bull support band, with $82K representing the crucial breakout level.
- Institutional demand remains robust with $623 million flowing into BTC ETFs last week, extending the positive streak to six weeks.
A historically significant technical pattern is forming on Bitcoin’s MVRV ratio chart, while the leading cryptocurrency maintains its position around the critical $82,000 threshold.
 Bitcoin (BTC) Price
The MVRV (Market Value to Realized Value) metric serves as a valuation tool to determine whether Bitcoin is trading above or below fair value. CryptoQuant’s analyst CW8900 identified an approaching golden cross formation between the MVRV ratio and its 200-day exponential moving average. The analyst characterized this development as “a representative trend reversal signal and is a bullish indicator.”
Historical precedent shows this pattern has materialized on two prior occasions. Following Bitcoin’s 2022 bear market bottom, the initial crossover event catalyzed a 90% surge from $16,300 to $31,000. Subsequently, a second cross formation in September 2023 initiated a remarkable 400% ascent toward the record peak of $126,000 reached in October 2025.
CW8900 additionally observed that Bitcoin’s 30-day simple moving average surpassed its 90-day counterpart in late April, declaring: “BTC has completely turned to a bullish trend.”
Technical Analysis and Institutional Activity
Cryptocurrency market analyst Daan Crypto Trades shared on X that Bitcoin achieved a “solid weekly close above the bull market support band,” emphasizing that a decisive break above the daily 200MA/EMA zone near $82K would represent “a signal of strength for further continuation.”
Concurrently, analytics platform SoSoValue reported in their recent update that Bitcoin exchange-traded funds accumulated $623 million in net positive flows throughout the week, marking the sixth consecutive week of institutional buying. The firm characterized this period as a “week of layered capital allocation” rather than an outright risk-on environment, observing some tactical profit-taking while institutional positioning continues to strengthen.
Market commentator Shib Spain identified Bitcoin’s breakout above a months-long descending trendline on the weekly timeframe, highlighting a bullish MACD reversal as technical confirmation. Fellow analyst Moustache observed the Bitcoin market capitalization RSI rebounding from multi-year monthly support, asserting: “Prices will go much, much higher.”
Current Trading Levels and Support Zones
Bitcoin encountered rejection above $81,500 and retraced lower, presently maintaining ground above $80,500 and its 100-hour simple moving average. Technical charts reveal a contracting triangle formation on the hourly timeframe, establishing support near $80,800.
Should BTC successfully breach $81,800 and $82,000, subsequent resistance barriers emerge at $82,250, $82,500, and $83,500. Conversely, downside protection exists at $80,400, followed by additional support at $79,400 and $78,500.
On-chain metrics indicate the short-term holder cost basis heated band positioned at $92,000, while the overheated threshold sits at $104,000. Despite recent profit realization activity, blockchain analytics from Glassnode indicate the price structure has additional upside potential in the near term.
Institutional appetite for Bitcoin ETFs generated $623 million in aggregate inflows during the previous week, representing the sixth uninterrupted week of positive capital flows. Long-term strategic allocation continues despite a brief two-day outflow pattern that concluded last week.
The post Bitcoin (BTC) Price: Historic MVRV Signal Returns, Signaling Potential Major Rally Ahead appeared first on Blockonomi.


추천 콘텐츠

Bitcoin (BTC) Hovers Above $77K Amid Iran Diplomacy and Rising Treasury Yields

Beyond Cleaning: What Else You Must Check Before Moving Out


