

Solana (SOL) Price: 9-Month Downtrend Is Broken — Is $120 Now on the Table?
TLDR
- Solana ETFs recorded their strongest weekly inflows since February, pulling in $39.23 million in total net flows.
- SOL futures open interest jumped 29.5%, from $4.94 billion to $6.4 billion, in under two weeks.
- SOL rallied 15% in seven days, reaching $97, with traders now eyeing $120 as the next key resistance.
- Crypto analyst CryptoPatel noted the downtrend on the SOL/BTC chart has broken, with $89–$91 acting as the nearest support zone.
- A dormant whale wallet bought 67,648 SOL worth $6.23 million after seven months of inactivity.
Solana’s spot ETF market had its best week since February. Total net flows hit $39.23 million, led by Bitwise’s BSOL ETF with $36 million of that total. Fidelity’s FSOL added just over $1.8 million. Since launch, BSOL has pulled in $861 million — about 81% of the $1.06 billion in cumulative inflows across all spot SOL ETFs.
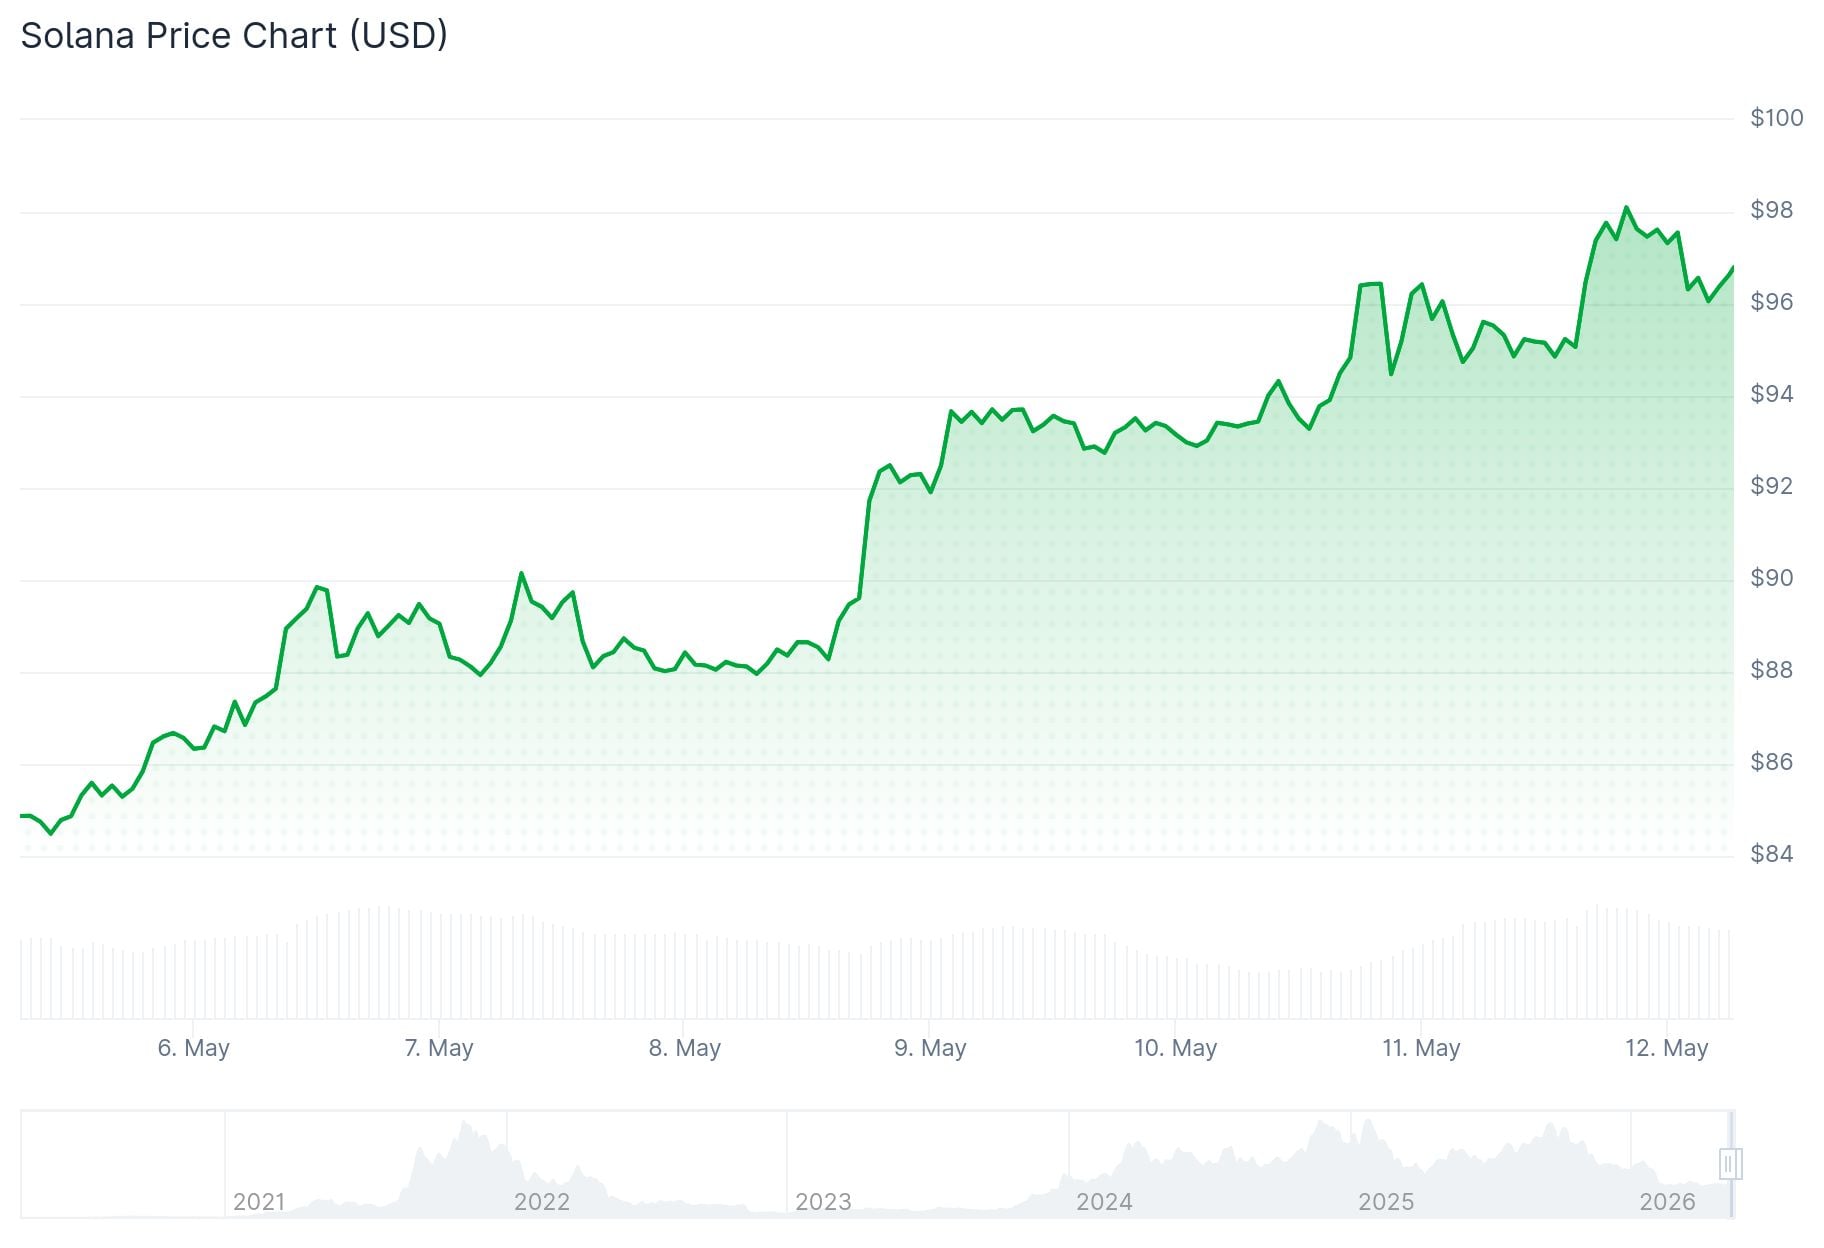 Solana (SOL) Price
That ETF demand came alongside a sharp rise in futures activity. Solana open interest climbed from $4.94 billion on May 1 to $6.4 billion, a 29.5% jump in under two weeks. The aggregated spot cumulative volume delta rose to nearly $250 million from $163 million in just five days during SOL’s push toward $96.
Futures CVD expanded to around $593.6 million as buyers absorbed sell-side pressure in both spot and futures markets. The funding rate held near 0.065%, showing traders were still paying to stay long.
Crypto analyst CryptoPatel posted on X that SOL had been “bleeding for 9 long months” but said the chart had finally turned. “The downtrend is broken and buyers are stepping in strong,” he wrote, adding that patience was paying off. Separately, analyst BATMAN noted that SOL recently broke above a 231-day downtrend on the SOL/BTC daily chart, suggesting improving relative strength against Bitcoin.
Whale Activity and ETF Holdings Add Fuel
On-chain data added more context to the bullish setup. A wallet identified as Emb5o returned after seven months of inactivity and bought 67,648 SOL worth approximately $6.23 million, along with 6.2 million JUP tokens.
The eight spot Solana ETFs are now approaching 2% of total SOL supply in holdings. ETF demand can reduce liquid supply over time, which has been part of the narrative driving institutional interest. Alchemy also launched a $20 million Solana developer fund on April 9, offering infrastructure support and credits for teams building on the network.
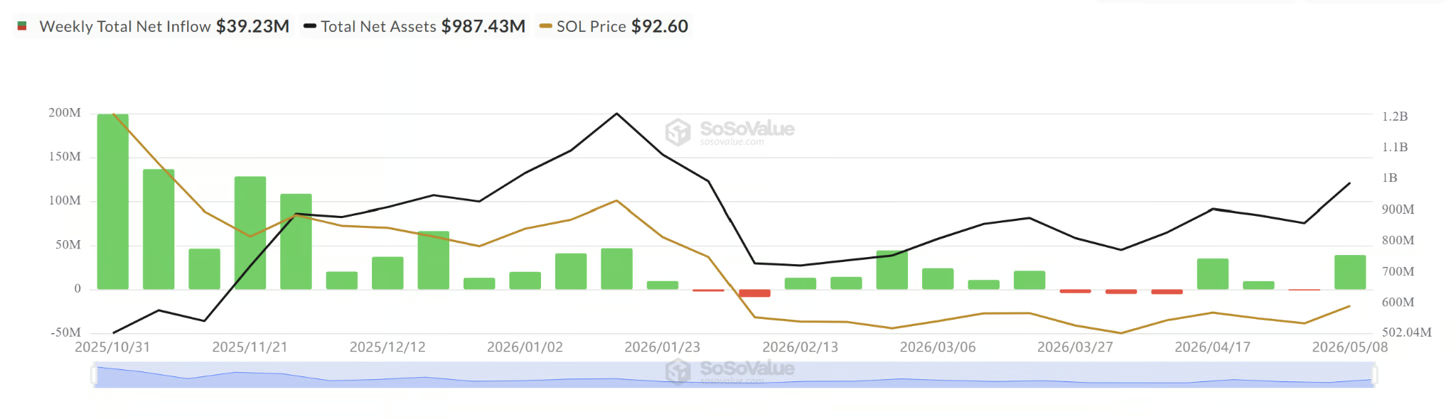 Source: SoSoValue
Network activity picked up in May, with higher numbers of daily active addresses and transactions. Solana-based meme coins saw renewed volume after a UFO-themed trading wave, which helped lift DEX activity and demand for SOL as gas.
Price Levels to Watch
Solana has pushed above its 100-day exponential moving average for the first time since October 2025. It is forming an Adam and Eve pattern near the $95 resistance level, with the pattern’s technical target sitting near $120.
Analyst BATMAN placed the $89–$91 zone as the nearest support cluster. The $90 level is also seen as the breakout support for short-term traders. A break below it would expose the 200-day average near $86.74.
SOL was trading near $93–$97 at time of writing. A confirmed daily close above $95 is the level traders are watching for a potential move toward $120.
The post Solana (SOL) Price: 9-Month Downtrend Is Broken — Is $120 Now on the Table? appeared first on CoinCentral.


추천 콘텐츠

Bitcoin (BTC) Hovers Above $77K Amid Iran Diplomacy and Rising Treasury Yields

Beyond Cleaning: What Else You Must Check Before Moving Out


