

Bitcoin Bulls Eye $85K To $88K As Price Holds Above Key 21 Day MA
Bitcoin trades near $81.9K as bulls target $85K to $88K resistance, with price holding above the key 21-day moving average.
Bitcoin traded near $81,890 on the daily chart, while bulls watched the $85,000 to $88,000 resistance zone.
The price also held above the 21-day moving average, which kept short-term momentum in focus.
Bitcoin Holds Above 21-Day Moving Average
Bitcoin remained above the 21-day moving average, a level often tracked by short-term traders. The move showed that buyers continued to defend recent support areas.
Market analyst Michael van de Poppe said Bitcoin was “clearly flipping levels for support.” He also pointed to a steady bid in the market, while Nasdaq strength remained intact.
The price action followed a sharp February sell-off, which some analysts compared with past market shocks.
Yet Bitcoin has since recovered from lower levels and moved back into a key trading range.
BTC was seen near $81,890, down about 0.37% on the session. The daily chart showed price trading above the $75,465 Fibonacci support.
Bulls Target $85K To $88K Resistance
The next resistance area sits between $85,000 and $88,000, according to the market view shared by analysts. This range also aligns with the 0.618 Fibonacci level near $86,514.
A daily close above $86,514 could support a move toward $94,274. That level marks the 0.5 Fibonacci retracement on the daily chart.
Bitcoin recently recovered from the $65,000 to $70,000 area. Buyers then pushed the price above the 0.786 Fibonacci level at $75,465.
That level is now the nearest key support. A move below it could shift attention back to $70,000 and $61,391.
Some traders still argue that Bitcoin is forming a bear flag. Others see the current structure as a recovery above short-term support.
The market also continues to watch whether Bitcoin can avoid a deeper move toward $50,000. For now, the chart shows price holding above near-term support.
Read Also:
RSI And MACD Show Firm Momentum
The daily RSI was near 66.40, while its signal line was around 62.49. This placed the indicator above the neutral 50 level.
The RSI has not yet crossed above 70. That means Bitcoin is not yet in overbought territory on this chart.
If RSI holds above 60, buyers may keep control of the current rebound. If it turns lower, price may retest the $75,465 support zone.
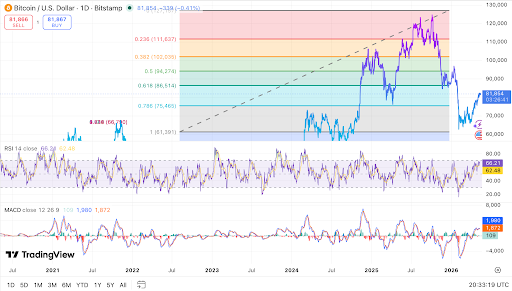 Bitcoin daily chart shows price holding above key Fibonacci support. Source: TradingView.
The MACD line was also above the signal line. The chart showed MACD near 1,983, while the signal line was near 1,872.
The histogram stayed positive near 111. This reading showed that short-term momentum still favored the recovery.
A wider MACD spread could support another test of resistance. A bearish crossover could increase pressure near support.
Bitcoin’s daily setup now depends on the $75,465 support and the $85,000 to $88,000 resistance zone.
A breakout above that range could bring $94,274 into focus. A loss of support may reopen a move toward lower levels.
The post Bitcoin Bulls Eye $85K To $88K As Price Holds Above Key 21 Day MA appeared first on Live Bitcoin News.


추천 콘텐츠

PMI-ACP Exam Preparation: How to Use a Simulator and Practice Questions Effectively

Bitcoin (BTC) Hovers Above $77K Amid Iran Diplomacy and Rising Treasury Yields


