

Circle stock rallies 16% on Q1 beat, yet momentum looks extended

Circle stock (CRCL) ripped higher after Q1 results, closing at $131.76, up roughly 16%. The daily trend is bullish, yet price finished beyond its upper volatility envelope. The base case stays constructive; however, near‑term froth raises the odds of a pause or shallow backfill.
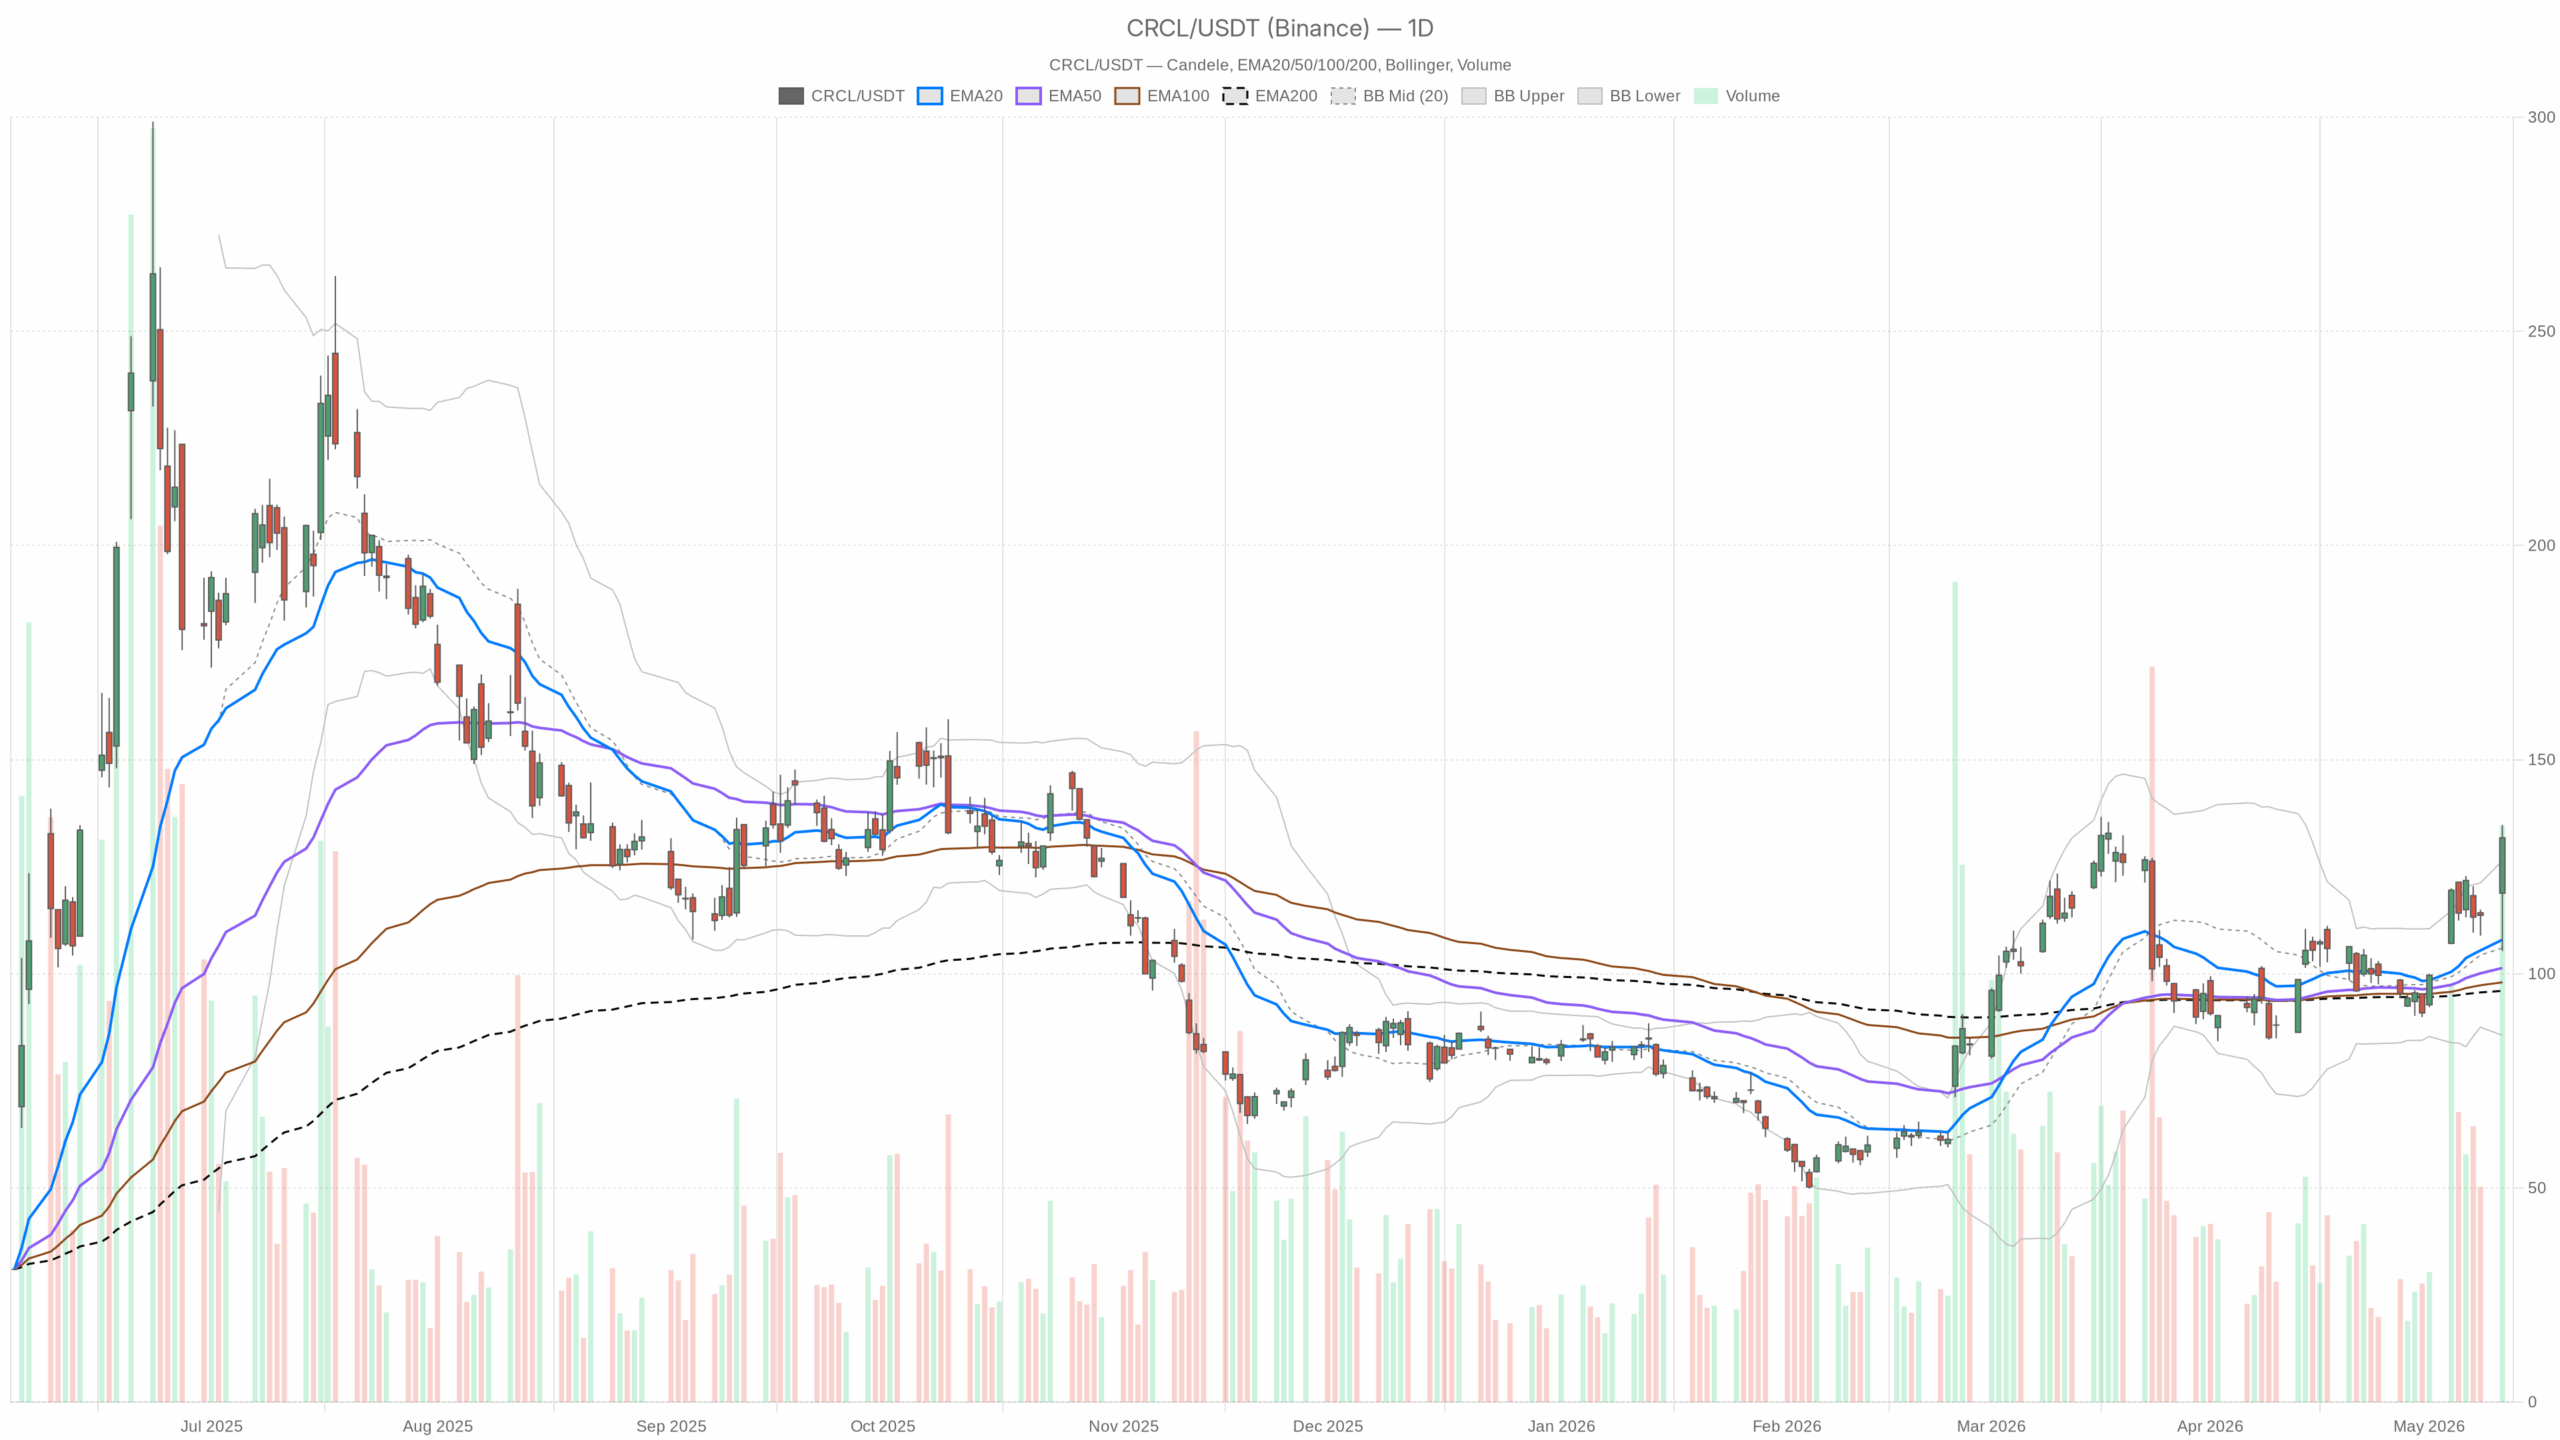 CRCL — daily chart with candlesticks, EMA20/EMA50 and volume.
Circle stock daily technical outlook
Trend and momentum
On the daily chart, price closed at $131.76, well above the 20/50/200‑day EMAs at 107.97/101.37/96.03. All three are rising beneath price, confirming buyers control the primary trend. Daily RSI14 is 65.71, showing strong momentum without excess. Daily MACD (line 5.52 vs. signal 2.74, hist 2.78) is positive and expanding, signaling a fresh impulse.
Volatility and levels
Daily Bollinger Bands (mid 106.05, upper 126.44, lower 85.65) show price closing above the upper band. That indicates strength but also short‑term extension. Meanwhile, daily ATR14 is 9.83, so volatility is elevated and swings are larger. Daily pivots (PP 123.96, R1 142.57, S1 113.16) place the breakout above PP, with R1 as the next magnet and PP/S1 layered support.
Fundamental and relative strength context for Circle stock
Notably, the move coincided with Circle’s Q1 update highlighting higher revenue and adjusted EBITDA growth. Expanding USDC transaction activity and product launches in stablecoins, blockchain infrastructure, and AI agents added near‑term catalysts. Circle stock is up about 68% year to date, indicating relative strength versus peers.
At the same time, one research desk flagged caution at current levels. That reminder is timely, as sharp gains often consolidate before trend continuation.
Intraday technicals: 1H trend for CRCL
Trend and momentum
The 1H timeframe backs the bullish daily view. Hourly EMAs at 121.09/114.67/106.31 sit beneath price and are rising, confirming trend control. However, hourly RSI14 at 70.2 is overbought, increasing pullback risk. Hourly MACD (line 4.79 vs. signal 2.98, hist 1.81) remains firmly positive.
Volatility and pivots
Hourly Bollinger Bands (mid 117.75, upper 134.6, lower 100.9) show price tracking the upper band, leaving room toward 134.6 before band resistance. Hourly ATR14 is 5.2, so the tape is fast intraday. Hourly pivots (PP 130.9, R1 133.27, S1 129.3) frame immediate support and a near‑term target cap.
15-minute execution layer: CRCL momentum check
After the surge, the 15‑minute layer shows fading momentum. Fifteen‑minute EMAs at 128.6/122.83/113.59 are stacked bullishly beneath price, so trend support is nearby. Fifteen‑minute RSI14 at 60.98 has cooled from extremes without breaking. However, the MACD (line 3.54 vs. signal 4.11, hist -0.57) shows a negative histogram, hinting at fatigue.
Fifteen‑minute Bollinger Bands (mid 130.03, upper 135.79, lower 124.27) place price above the mid‑band, suggesting consolidation rather than a full reversal. Meanwhile, 15‑minute pivots (PP 131.36, R1 132.81, S1 130.23) and ATR14 at 2.59 indicate scalping ranges are a few dollars wide.
Scenarios: bullish continuation levels for CRCL
Therefore, the bullish path is intact while price holds above the hourly PP at 130.9 and, ideally, above 129.3 on dips. A clean drive through hourly R1 at 133.27 and toward the hourly upper band near 134.6 would keep the squeeze alive. On the daily map, that opens room toward R1 near 142.57 if momentum persists.
Daily RSI holding in the mid‑to‑high 60s and a still‑rising daily MACD histogram would confirm that buyers remain in control.
Risk case: signs of exhaustion and pullback
In contrast, the bullish case weakens if intraday supports fail. A move back below 130.9 and 129.3 would signal momentum loss on the 1H. A daily close back inside the upper Bollinger band would confirm extension is reverting, shifting focus to the daily PP at 123.96 and then S1 at 113.16.
A deeper 15‑minute MACD deterioration while RSI rolls over would reinforce a shift toward consolidation or a larger pullback.
Bottom line: Circle stock bullish but extended
Overall, CRCL remains bullish across higher timeframes, yet it is tactically extended after an earnings‑fueled run. Positioning should respect elevated ATRs on both daily and hourly charts, as volatility can magnify breakouts and retracements. Until the 1H trend breaks, dips into the 130–131 area are more likely to be absorbed.


추천 콘텐츠

PMI-ACP Exam Preparation: How to Use a Simulator and Practice Questions Effectively

Bitcoin (BTC) Hovers Above $77K Amid Iran Diplomacy and Rising Treasury Yields


