

Bitcoin Price Today: BTC at $80,860 After Failing $82,000 Again – The Biggest Week of 2026 Starts Now

Bitcoin is trading near $80,860 on May 12, 2026. The session started with a sharp dip to $80,300, buyers stepped in fast, price ran back to $82,000, and then the same thing that has happened every time BTC gets near that level happened again. Sellers showed up. Price faded. Now it is sitting just above the open, slightly below $81,000, waiting for something to change.
That something might come this week. Three macro events land before Friday, any one of which can move BTC harder than anything the chart has shown in a month.
What the Chart Shows
BTC opened near $80,730. The early dip to $80,300 was fast and looked like a stop hunt rather than real selling. Recovery was equally fast, and by 10:00 PM price had pushed to a session high near $82,000.
Then the 200-day moving average at $82,228 did what it has done every time BTC has approached it in the past two weeks. It rejected price. The overnight session slowly gave back the gains, and BTC is now sitting at $80,860, barely above where the session started.
Volume was decent on the way up, light on the fade. That is the healthier pattern of the two, but it does not change the basic problem: four attempts at $82,000, four rejections.gle time.
BTC/USD Chart: $82,000 Keeps Rejecting Price
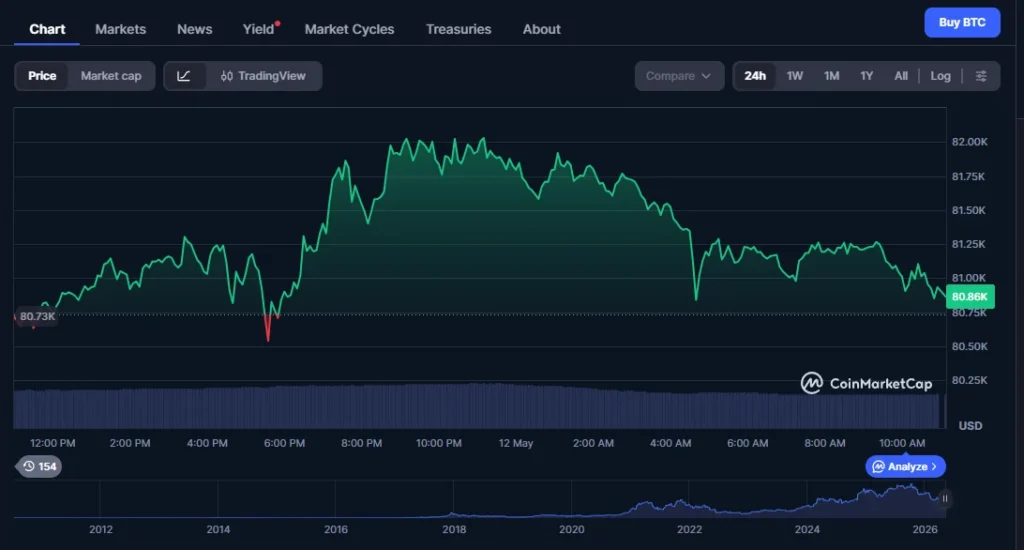 BTC/USD 24H chart showing the session dip to $80,300, recovery to $82,000, and fade back to $80,860. Source: CoinMarketCap.
The level that matters most is still $82,228. A daily close above it would be the first since October 2025 and the clearest signal yet that the recovery from April’s $74,900 low is a real trend change, not just a bounce into resistance.
Until that close happens, every rally to $82,000 is just another test of a ceiling that has not broken yet.
On the downside, $80,000 is what bulls need to hold. It has been defended every time this month. A daily close below it reopens the path to $79,000 and then $77,500.
This Week Is Not a Normal Week
Three things land between May 14 and May 15 that can override anything happening on the chart.
First, the Senate Banking Committee holds a hearing on the CLARITY Act on May 14. This is the biggest crypto legislation currently moving through the US government. Positive signals from that hearing unlock institutional capital that has been sitting out while waiting for regulatory clarity.
Second, Jerome Powell’s term ends May 15 with Kevin Warsh expected to take over as Fed Chair. New Fed leadership has historically created short-term uncertainty in risk assets. BTC has sold off around each of the last three Fed Chair transitions. History does not always repeat, but the pattern exists.
Third, CPI and PPI data drop this week. A soft inflation print gives the incoming Fed Chair cover to lean dovish, which supports BTC. A hot number creates headwinds.
The Fear and Greed Index is sitting at 47 (Neutral). Retail has not piled in yet. That is usually a healthy sign that the rally still has room, if the catalysts cooperate.
Key Levels
Support: $80,730 (session open) / $80,000 / $79,000 Resistance: $82,000 / $82,228 (200-day MA) / $85,000
Bottom Line
Same chart, same ceiling. BTC ran to $82,000 and got pushed back to $80,860. The 200-day MA has rejected price four times in two weeks and has not budged.
This week provides three macro catalysts that the chart cannot provide on its own. CLARITY Act hearing, Fed Chair change, CPI. One clean close above $82,228 and the whole technical picture changes. Until then, BTC is range-bound and waiting.
Neutral. The setup is fine. The move needs news behind it.
This article is for informational purposes only and does not constitute financial advice.


추천 콘텐츠

PMI-ACP Exam Preparation: How to Use a Simulator and Practice Questions Effectively

Bitcoin (BTC) Hovers Above $77K Amid Iran Diplomacy and Rising Treasury Yields


