

Will Ethereum price lose $2,200 support as bearish RSI divergence forms?
Ethereum price slipped lower on Monday as weakening momentum indicators and slowing institutional accumulation raised concerns that ETH could retest the key $2,200 support zone in the near term.
- Ethereum price formed a bearish RSI divergence near the $2,400 resistance zone, raising risks of a retest below the $2,200 support level.
- Ethereum whale wallets accumulated roughly 360,000 ETH during the recent correction, though Bitmine has slowed purchases as it nears its supply target.
- Fundstrat’s Tom Lee said “Crypto Spring has commenced” as ETH continued holding above its long-term ascending support trendline.
According to data from crypto.news, Ethereum (ETH) price was trading around $2,288 at press time on May 12 after failing to sustain recent gains above the $2,400 region. The token has gradually lost momentum over the past several sessions despite broader crypto market strength earlier this month.
One of the biggest warning signs now emerging on the daily chart is a developing bearish divergence on the RSI indicator. While Ethereum price continued forming slightly higher highs since April, the RSI has steadily printed lower highs over the same period, often a signal that bullish momentum is weakening underneath the surface.
The recent pullback also comes as institutional accumulation activity begins to slow after months of aggressive buying.
Recent on-chain data showed Ethereum whale wallets excluding exchanges increased holdings from roughly 124.69 million ETH to nearly 125.05 million ETH during the recent correction phase, representing an accumulation of approximately 360,000 ETH.
However, buying momentum appears to have moderated in recent weeks as some large holders turned more cautious near current price levels.
At the same time, Bitmine has reportedly slowed its ETH accumulation pace as the firm is already 86% of the way toward its target of holding 5% of Ethereum’s circulating supply, reducing the need for aggressive buying in the short term.
Despite the recent weakness, some market analysts remain optimistic on Ethereum’s longer-term outlook. Fundstrat’s Tom Lee recently stated that “Crypto Spring has commenced,” arguing that investor sentiment remains unusually bearish even as crypto prices continue recovering.
On the daily chart, Ethereum continues trading above an ascending support trendline that has remained intact since late March. However, price has repeatedly failed to break above the broader resistance zone near $2,400–$2,450, where sellers continue defending upside momentum aggressively.
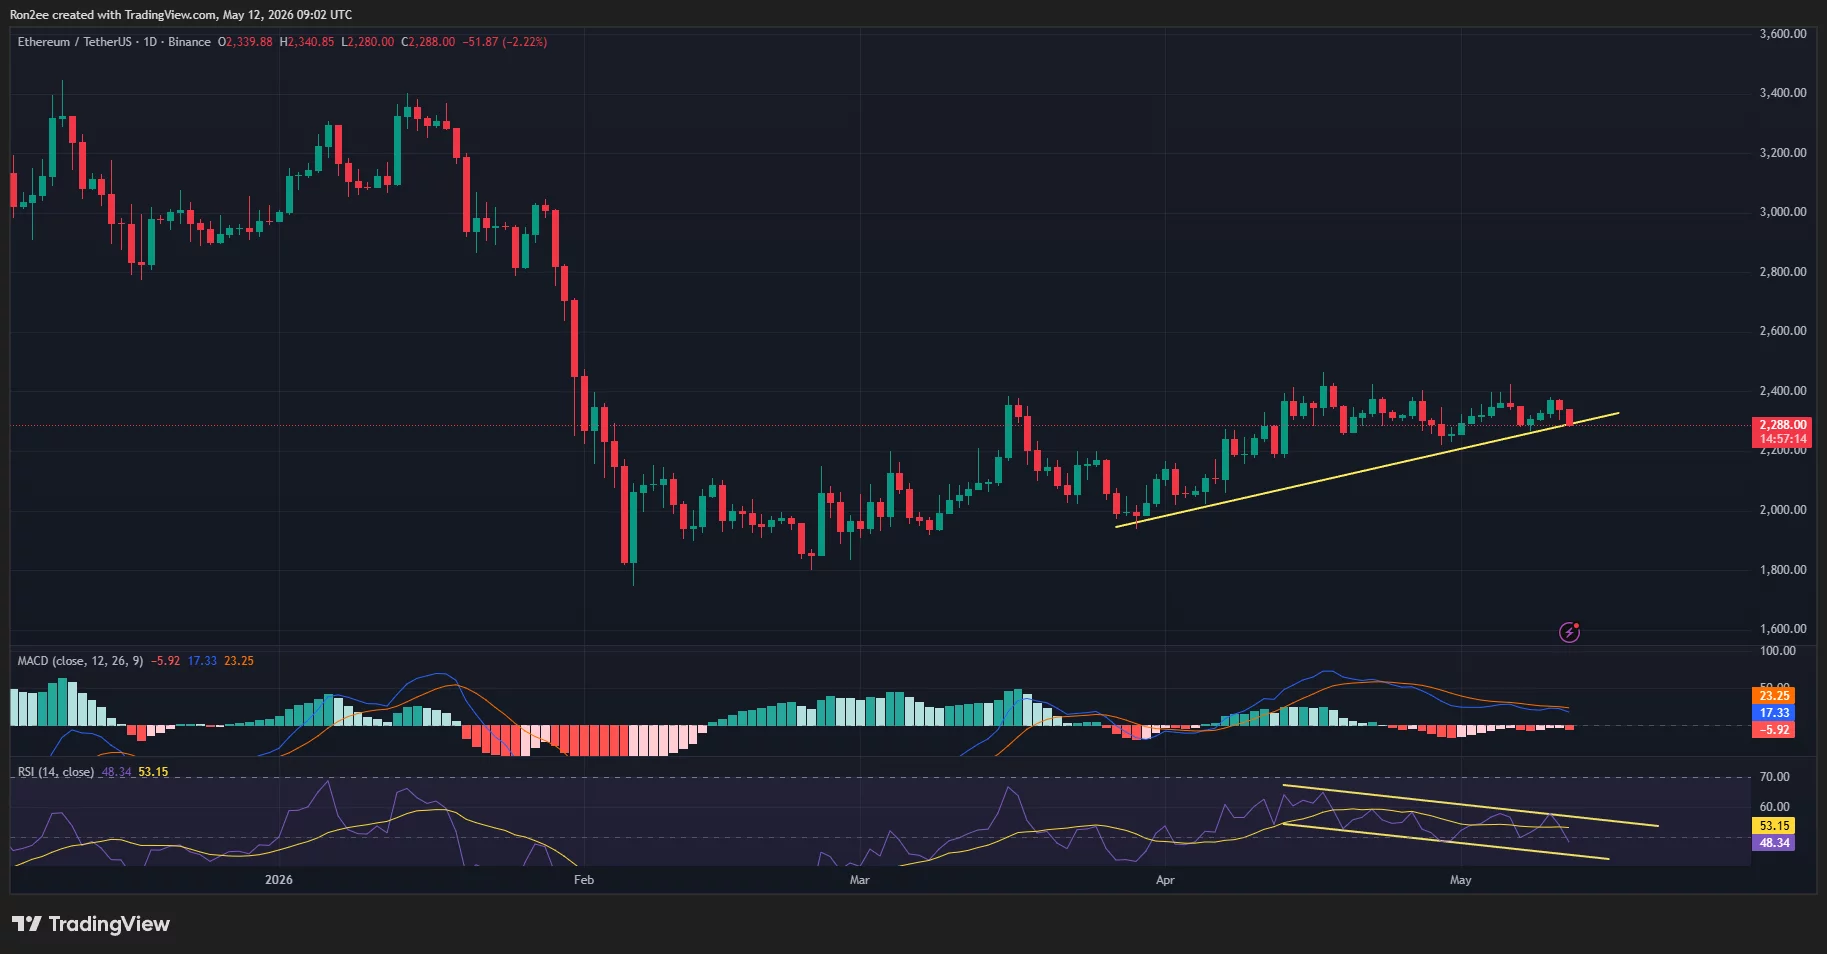
The bearish RSI divergence visible on the chart suggests buying pressure has gradually weakened even as ETH attempted to stabilize near local highs.
Meanwhile, the MACD has started turning bearish after completing a negative crossover, while the histogram continues printing fading red bars, signaling that downside momentum may be beginning to build.
If selling pressure accelerates further, Ethereum could retest the ascending support trendline near the $2,200 region. A decisive breakdown below that level could expose ETH to deeper downside toward the $2,000 psychological support zone.
On the upside, bulls would need to reclaim the $2,400 resistance area to invalidate the bearish setup and potentially reopen the path toward the next major resistance near $2,600.
Disclosure: This article does not represent investment advice. The content and materials featured on this page are for educational purposes only.


추천 콘텐츠

PMI-ACP Exam Preparation: How to Use a Simulator and Practice Questions Effectively

What a $900 Investment in New Crypto Protocols Could Become by Late 2027


