

Will Bitcoin price drop below $80K as Coinbase premium stays negative?
Bitcoin price slipped back toward the $81,000 region on Monday as weakening U.S. institutional demand and renewed geopolitical uncertainty triggered another wave of profit-taking across the crypto market.
- Bitcoin price fell back toward the $81,000 region after another rejection near the $82,000 resistance zone amid rising geopolitical uncertainty.
- The Coinbase Bitcoin Premium Index remained negative, signaling weaker buying demand from U.S. institutional investors in recent sessions.
- Technical indicators showed BTC still trading inside an ascending channel, though weakening MACD momentum raised risks of a retest below the $80,000 support level.
According to data from crypto.news, Bitcoin (BTC) traded around $80,900 at press time on May 12 after briefly falling toward an intraday low near $80,700. The pullback followed another failed breakout attempt above the key $82,000 resistance zone, where sellers continued aggressively defending upside momentum.
One of the biggest bearish signals came from the Coinbase Bitcoin Premium Index, which remained deeply negative throughout the past several trading sessions. The metric measures the price difference between Bitcoin on Coinbase and offshore exchanges such as Binance and is commonly used as a proxy for U.S. institutional demand.
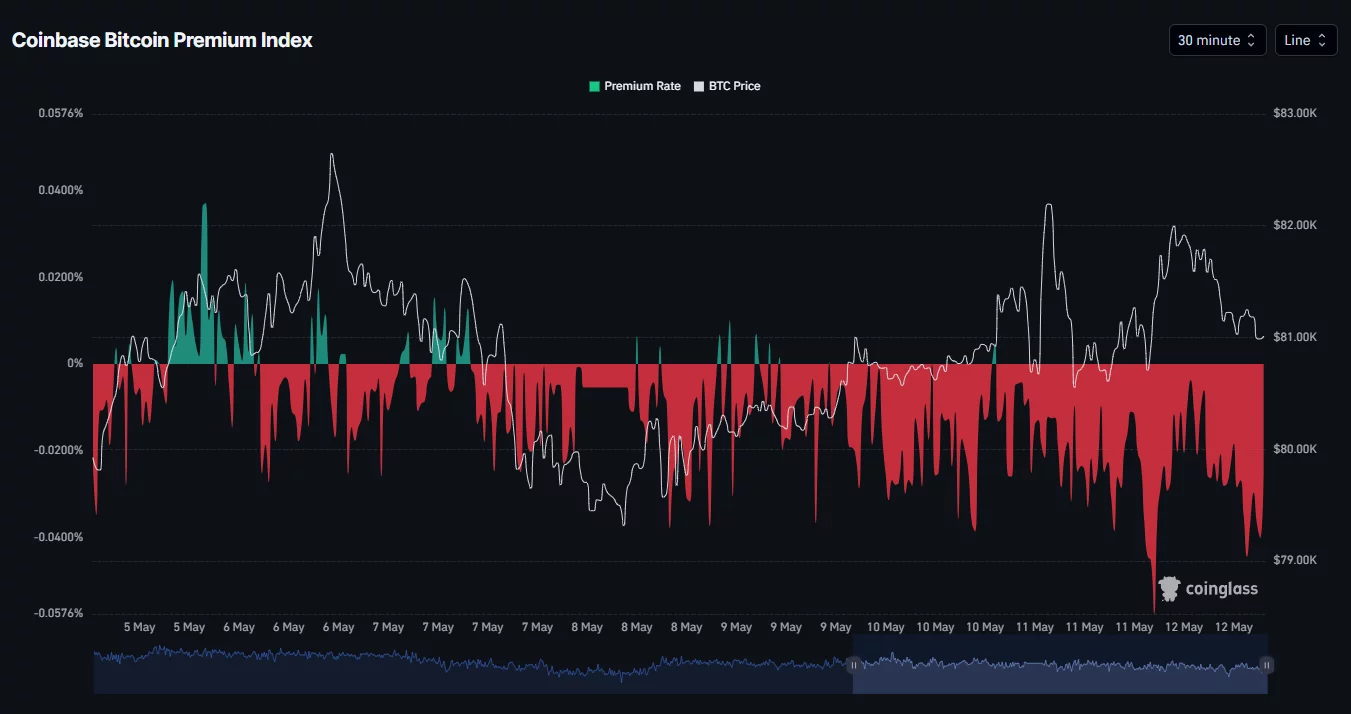
The persistent negative reading suggests that buying activity from U.S.-based investors has weakened considerably, even as Bitcoin attempted to stabilize above major support levels.
Market sentiment also deteriorated after reports indicated that U.S. President Donald Trump rejected a recent peace proposal from Iran, calling the offer “totally unacceptable.” The development renewed concerns that tensions between the two nations could escalate further, pushing investors away from risk assets like cryptocurrencies.
The geopolitical uncertainty triggered another rise in risk-off sentiment across global markets while oil prices remained volatile following the latest developments surrounding the conflict.
At the same time, traders continued locking in profits after Bitcoin’s recent rally toward the $82,700 region. Some analysts have also started warning that the latest rebound could potentially resemble a dead cat bounce following Bitcoin’s strong recovery from February lows.
Institutional flows have additionally shown signs of cooling in recent sessions. Spot Bitcoin ETFs reportedly recorded roughly $350 million in outflows during a recent 48-hour period, weakening short-term bullish momentum as markets repositioned around the weekly CME gap.
Bitcoin price analysis
On the daily chart, Bitcoin price continues trading inside a broader ascending parallel channel structure that has remained intact since late March. The bellwether recently touched the upper boundary of the channel before facing rejection near the $82,000 resistance region.
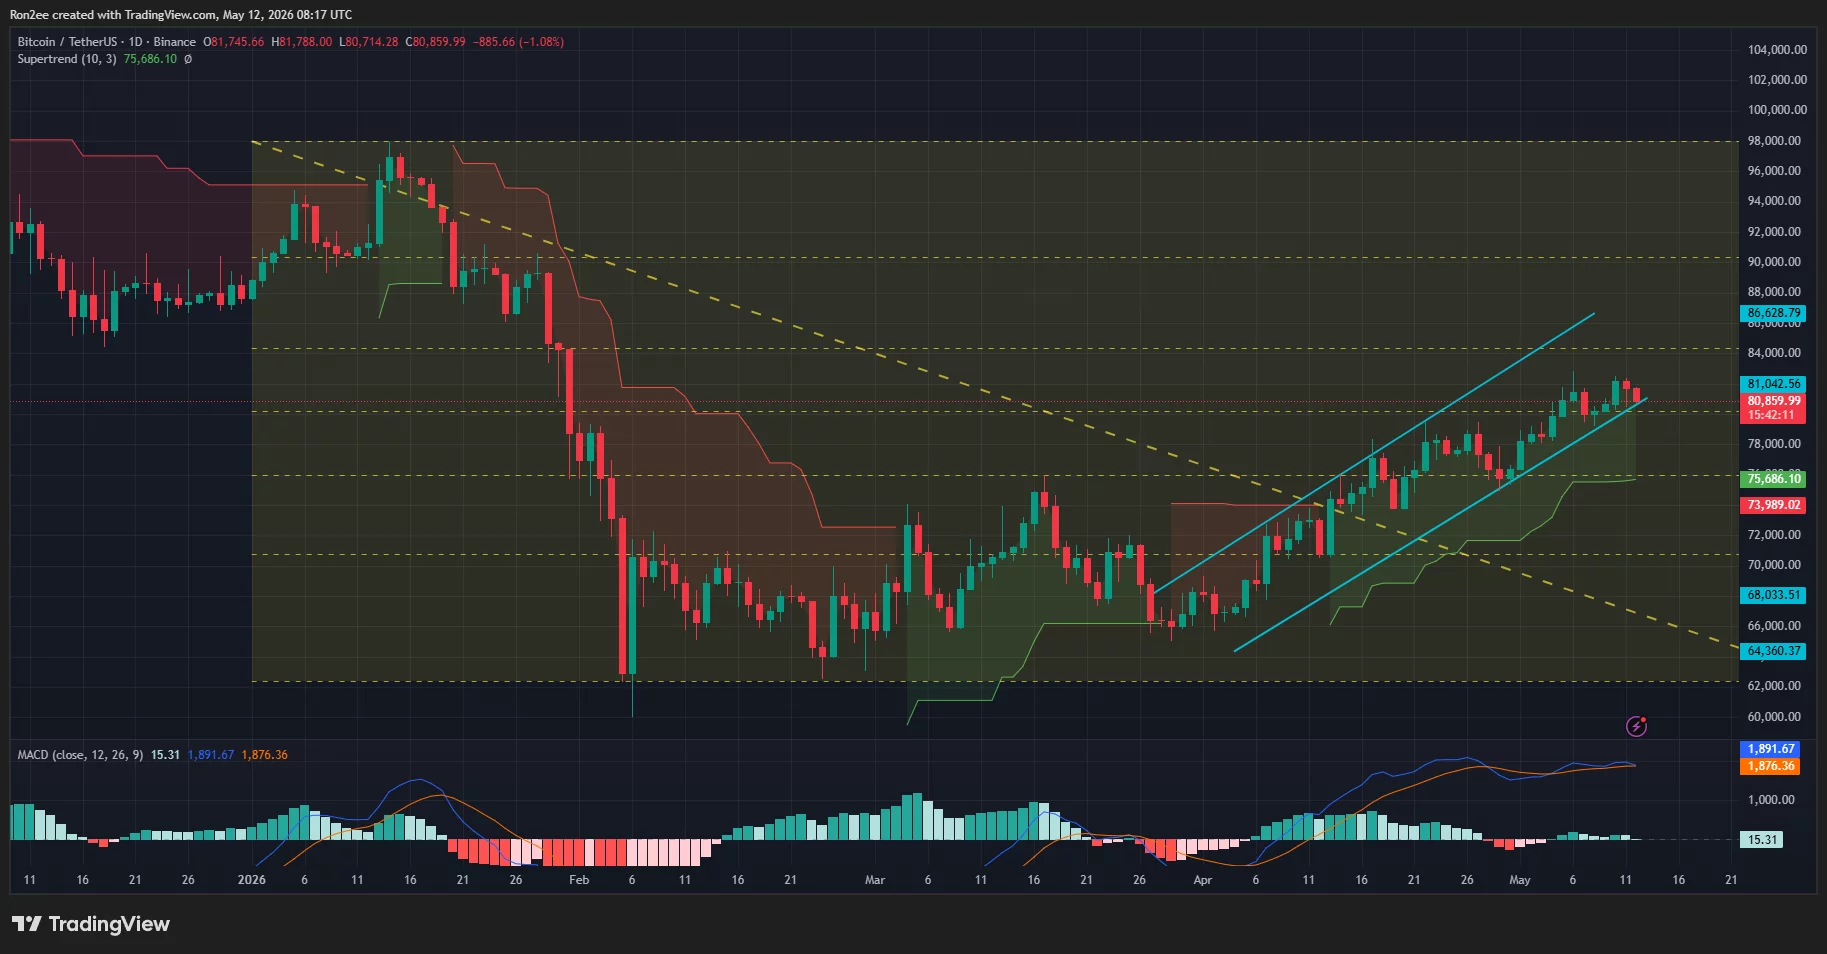
The chart also shows BTC struggling to sustain momentum above the key 0.786 Fibonacci retracement level near $80,000, a zone that continues acting as an important psychological battleground between bulls and bears.
Despite the recent pullback, Bitcoin still remains above the Supertrend support level near $75,600, indicating that the broader bullish trend structure has not yet fully broken down.
Meanwhile, the MACD remains in positive territory, although the histogram has started flattening considerably over recent sessions, suggesting bullish momentum may be weakening as buyers lose short-term control.
If selling pressure intensifies further, Bitcoin could retest the lower boundary of the ascending channel near the $80,000 psychological support zone. A decisive breakdown below that level could expose BTC to deeper downside toward the $76,000–$77,000 region.
On the upside, bulls would need to reclaim the $82,000 resistance area to restore bullish momentum and potentially reopen the path toward the next major resistance near $84,000.
Disclosure: This article does not represent investment advice. The content and materials featured on this page are for educational purposes only.


추천 콘텐츠

PMI-ACP Exam Preparation: How to Use a Simulator and Practice Questions Effectively

What a $900 Investment in New Crypto Protocols Could Become by Late 2027


