

XRP presses 1.48 ceiling; 200‑day at 1.78 still caps Ripple crypto trend
With price leaning against resistance and volatility compressed, Ripple crypto sits at a pivotal spot where structure outweighs momentum. Bulls have the short-term initiative above the 20/50-day averages, yet the 200-day still governs the macro path.
Thesis — XRP is leaning on the top of its recent range while the broader market sits in neutral. Price is comfortably above the 20/50-day averages but still well below the 200-day, which keeps the larger trend unresolved. With volatility compressed and Bitcoin dominance elevated, structure is trumping momentum; bulls hold the short-term initiative, but the higher-timeframe ceiling still rules.
However, daily indicators show constructive pressure, yet price hasn’t reclaimed the daily pivot or punched through the upper band. That sets up a ‘prove it’ day for XRP—either expand higher on a clean reclaim of 1.47–1.48 or mean-revert back toward the mid-band.
Context: headline flow around Ripple’s new debt facility with Neuberger (Bloomberg, May 11) may be a modest sentiment tailwind, but technical confirmation is required. Moreover, the tone is cautious: Bitcoin dominance near 58% and Fear/Greed at 49 argue altcoins won’t get a free pass without levels breaking.
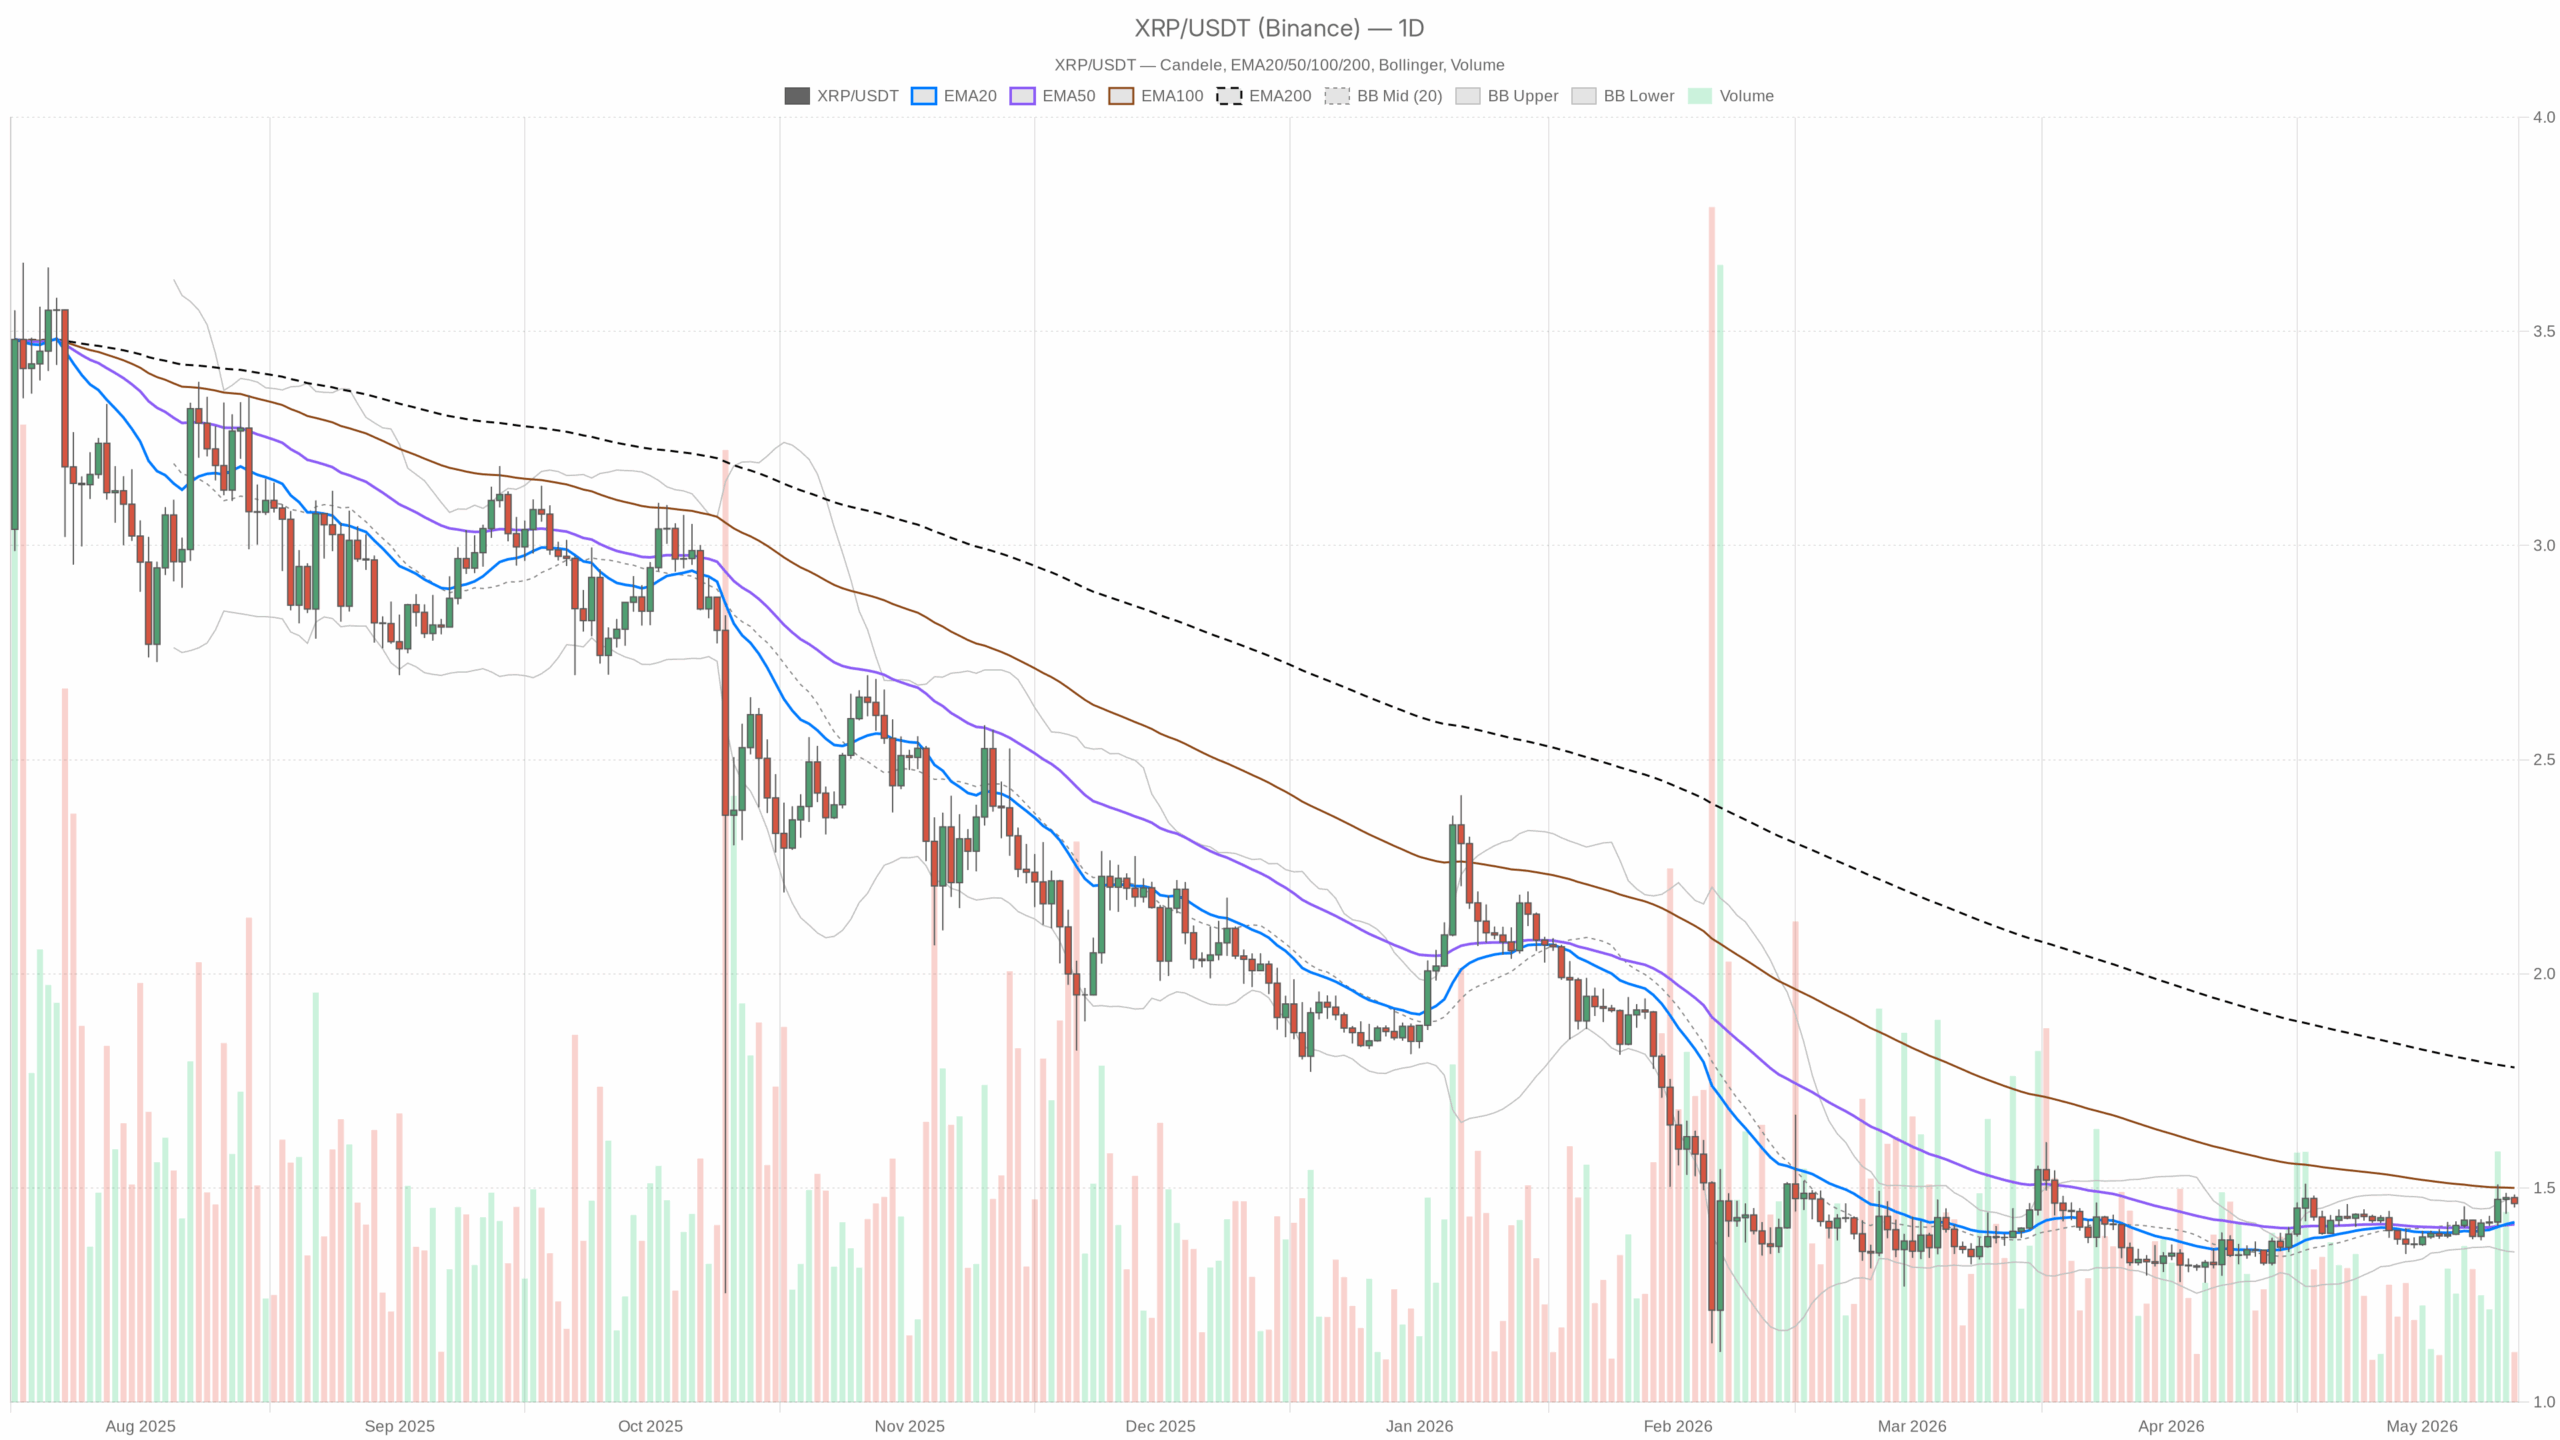 XRP/USDT — daily chart with candlesticks, EMA20/EMA50 and volume.
Daily (macro bias) — Neutral with a bullish tilt until the 200-day is reclaimed
- EMA: 20D = 1.42, 50D = 1.42, 200D = 1.78 — Price at 1.46 is above the 20/50 but well below the 200. The medium term is repairing. The long-term downtrend line still caps rallies.
- RSI (14): 60.2 — Healthy buying pressure without being stretched; room to extend if levels give way.
- MACD: line 0.02 vs signal 0.01, hist 0.01 — Positive but thin momentum; needs follow-through above resistance to matter.
- Bollinger Bands: mid 1.41, upper 1.48, lower 1.35 — Price is near the upper band; buyers are pressing the edge of the range but haven’t broken out.
- ATR (14): 0.04 — Compressed daily volatility; breaks can travel once they start, but fakeouts are common when ranges are tight.
- Pivots: PP 1.47, R1 1.48, S1 1.45 — Trading just under PP. Acceptance above 1.47/1.48 is the first real tell for an expansion higher. Losing 1.45 hands the ball back to mean reversion.
1H (tactical confirmation) — Flat and indecisive
- EMA: 20H = 1.47, 50H = 1.46, 200H = 1.43 — Price is pinned between the short EMAs. Trendless chop above the 200H shows support beneath but no immediate impulse.
- RSI (14): 49.7 — Dead neutral; momentum is waiting on a trigger.
- MACD: roughly flat at 0 — No edge intraday; momentum needs a level break.
- Bollinger Bands: mid 1.47, upper 1.49, lower 1.45 — Narrowing bands; a squeeze often precedes a move.
- ATR (14): 0.01 — Quiet tape; micro breaks may whipsaw until a clear push holds beyond the band.
- Pivots: PP 1.46, R1 1.47, S1 1.46 — Price is orbiting PP; a close above 1.47 on the hour would finally align intraday with the daily bid.
15m (execution context) — Coiled
- EMA: 20 = 1.46, 50 = 1.47, 200 = 1.46 — Braided averages; microstructure is balanced and prone to liquidity grabs.
- RSI (14): 48.5 — Slightly soft but effectively neutral; no divergence edge.
- MACD: flat — No micro-momentum; wait for a break-and-hold.
- Bollinger Bands: mid 1.46, upper 1.47, lower 1.46 — Very tight; expect a stop-run on either side before direction sets.
- ATR (14): near 0 — Ultra-low volatility; precision entries matter, tolerance for noise is low.
- Pivots: PP 1.46, R1 1.47, S1 1.46 — Micro levels mirror the bigger map; 1.46 is the battleground.
Market logic
Trend vs. mean reversion: Daily structure favors a push attempt (above 20/50D, RSI > 60), but failing to reclaim the pivot keeps mean reversion alive. Momentum vs. structure: momentum is budding but not decisive. For Ripple crypto, the 200D at 1.78 remains the macro filter—until reclaimed, treat upside as corrective. Risk appetite is neutral across crypto, and volumes are lighter, so breakouts require proof, not anticipation.
Scenarios and levels
Bullish path: Hold 1.45–1.46, then reclaim and hold above 1.47 (daily PP) and 1.48 (R1/upper band). That would likely expand the bands and invite a trend day higher. From there, the path opens toward round-number friction near 1.50. If momentum sustains, a climb into the mid-1.50s is plausible. The bigger prize remains the 200D at 1.78, which would mark a genuine trend shift if recovered on a daily close. Invalidation for the bullish path: a daily close back below 1.45 that also drags price under the 20/50D, with RSI slipping toward 50 and MACD rolling negative.
Bearish path: Fail to retake 1.47/1.48 and break below 1.45, inviting mean reversion into 1.41 (BB mid). If sellers press, 1.35 (BB lower) is the next logical magnet. Invalidation for the bearish path: a strong hourly close above 1.48 that sticks, followed by a daily close above 1.48 with rising ATR—acceptance and expansion, not just a wick.
Positioning view
Overall, bias is neutral on the daily with a slight bullish lean, but the tape is coiled and headline risk exists. In low-ATR conditions, position sizes should respect the likelihood of fakeouts around 1.45 and 1.47. For proactive traders, the clean setup is to trade acceptance: participate on holds above 1.48 or below 1.45 rather than guessing the break. For swing participants, the 200D at 1.78 is still the north star for a durable trend shift; until then, treat upside as tactical and respect the range.
In summary, XRP is pressing resistance with compressed volatility, and confirmation above 1.48 or back below 1.45 should define the next leg while the 200-day frames the macro.


추천 콘텐츠

PMI-ACP Exam Preparation: How to Use a Simulator and Practice Questions Effectively

What a $900 Investment in New Crypto Protocols Could Become by Late 2027


