

Silver Price 2026 High Could Endure for Years, Bloomberg Analyst Warns
Bloomberg Intelligence analyst Mike McGlone issued a warning on silver. He says the metal’s 2026 high could endure for years. Silver has changed from a store of value to an industrial commodity, making it more elastic and volatile. McGlone points to extreme volatility readings that historically preceded stock market drawdowns.
Let’s break down his chart and analysis, then add our own silver price outlook.
Mike McGlone’s Take: Volatility Spread at 2.3x – A Peaking Process
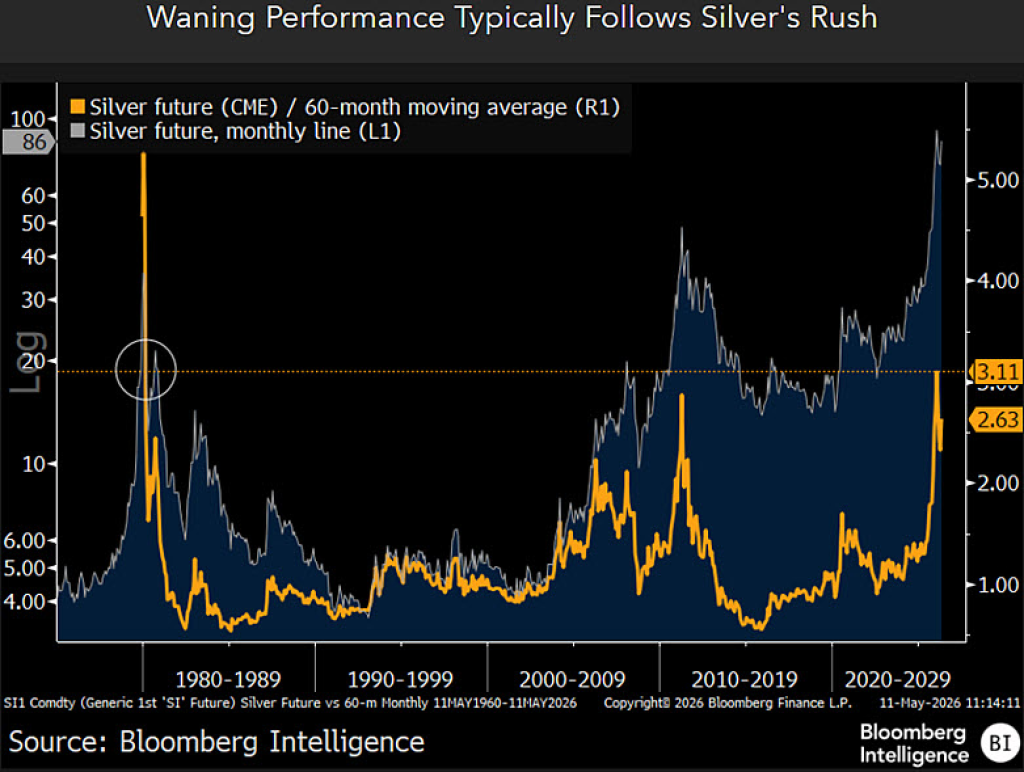
McGlone posted a chart showing silver futures relative to their 60-month moving average. The data spans from 1980 to 2029 (estimated). The ratio spikes near 6.0 in the 2020-2029 period, similar to levels seen in the 2010-2019 peak (ratio around 3.0–4.5) and the 1980 peak (ratio near 4.5). His message: when silver’s price sits this far above its long-term moving average, it often marks a cyclical top.
He also compares gold and S&P 500 volatility. Silver’s 180-day volatility is now 2.3 times that of the S&P 500 – the highest ratio since 2006. The previous peak in the gold/SPX volatility spread (around 2.5x) came in 2006-2007, just before the financial crisis. That spread foreshadowed a drop in the stock market’s cap-to-GDP ratio from 1.3x to 0.6x by 2009.
 Source: X/@mikemcglone11
McGlone argues that gold and silver have made a rare shift to volatile risk assets instead of safe havens. That often marks price peaks. He worries that the stock market, at 2.4x GDP, risks a typical post-inflation deflation cycle.
Chart analysis (first chart)
The silver futures line (monthly) climbs steeply from near zero in 1980 to roughly $25 in 2026. The 60-month moving average (dashed line) rises more slowly. The ratio between price and the MA is shown on the right-hand scale, peaking near 6.0 in the current period.
Historically, ratio peaks above 4.0 occurred in:
- 1980
- 2011
- 2026
Each time, silver corrected for years afterward.
Silver Price Analysis
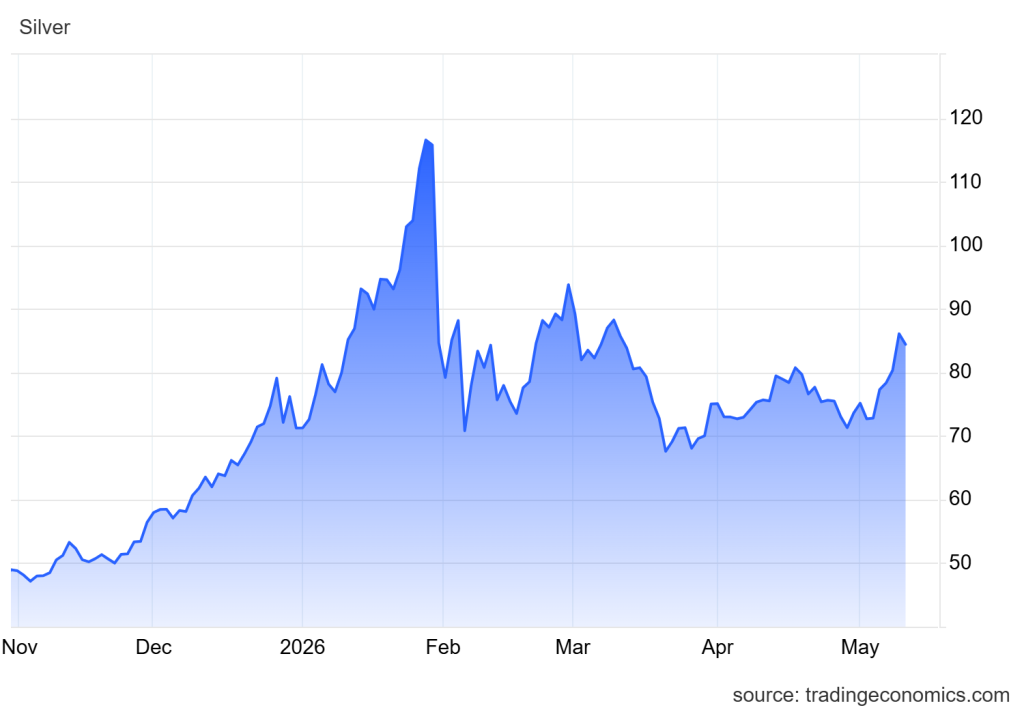
The silver chart shows price action from November 2025 through May 2026. The structure is highly volatile, with multiple sharp rallies and equally aggressive pullbacks. Silver price remains in a broad bullish trend, but momentum has become unstable near major resistance zones.
Key price movements
- November 2025: Silver traded near $48–50 and began a steady breakout phase.
- December 2025: Momentum accelerated as price climbed into the $60–70 range.
- January 2026: Strong speculative buying pushed silver above $90.
- Late January / Early February 2026: A blow-off top formed near $115–116, followed by an immediate crash toward the low $80s.
- February 2026: Extreme volatility continued, with rebounds toward $88 followed by sharp selloffs near $70–72.
- March 2026: Silver attempted another recovery rally, peaking near $93–94 before failing again.
- April 2026: Price consolidated between $70 and $80, creating a broad sideways range.
- May 2026: Silver rebounded again and is now testing the $85 area.
 Source: tradingeconomics.com/commodity/silver
Market structure
The chart shows a classic speculative spike followed by distribution. The parabolic move into the $115 zone was unsustainable and immediately rejected. Since then, silver has entered a wide consolidation structure with repeated lower highs:
- Peak 1: ~$115
- Peak 2: ~$94
- Current rally: ~$85
That sequence indicates weakening upside momentum despite continued volatility.
At the same time, silver has consistently defended the $68–72 support zone. Buyers repeatedly step in there, preventing a full collapse. This creates a large trading range between roughly $70 and $90.
Key support levels
- $82–85: Immediate short-term support if breakout succeeds
- $70–72: Major structural support zone
- $60–65: Panic support if macro conditions weaken
Key resistance levels
- $85: Current breakout test
- $90–94: Major resistance from March rebound
- $115–116: Blow-off top and long-term resistance ceiling
Technical interpretation
Silver remains bullish on a long-term basis because higher lows continue to form compared to late 2025. However, the repeated failures near resistance indicate exhaustion. The market appears trapped between industrial-demand optimism and speculative overheating.
Momentum indicators implied by the chart structure suggest:
- Trend strength weakened after February
- Volatility remains elevated
- Buyers still defend dips aggressively
- Breakouts above resistance are failing quickly
This usually leads to extended consolidation before the next major directional move.
Silver Price Predictions
Short-Term Prediction (Next 1–3 Months)
Silver is approaching a critical decision zone around $85.
Bullish scenario
If silver breaks above $85 with strong momentum and volume, the next targets become:
- $90
- $94
- Potential retest of $100
A breakout above $94 would likely trigger renewed speculative buying.
Bearish scenario
If $85 rejects price again, silver likely rotates back toward:
- $78
- $72
- Possibly $68 support
Right now, rejection remains slightly more probable because every major rally since February has failed beneath the previous peak.
Medium-Term Prediction (Rest of 2026)
The most likely scenario is continued high volatility inside a broad:
- $70–95 trading range
Silver no longer behaves like a slow-moving monetary metal. It trades more like a momentum-driven industrial commodity tied to:
- AI infrastructure demand
- Solar manufacturing
- EV production
- Macro liquidity conditions
A sustained move above $95 would require either:
- Major monetary easing
- Severe inflation fears
- A weakening U.S. dollar
- Strong industrial demand acceleration
Without those catalysts, silver price may struggle to escape consolidation.
Long-Term Prediction (2027–2028)
The chart indicates the January 2026 spike near $115 may have been a temporary speculative excess rather than the start of a straight-line supercycle.
However, unlike previous silver cycles, industrial demand creates a much stronger long-term floor. Because of that:
- A collapse back below $40 appears unlikely
- Deep pullbacks will probably attract institutional accumulation
Most likely long-term range:
- $60–100 over the next several years
Silver may spend years consolidating and repricing gradually rather than exploding vertically again.
All in all, Mike McGlone warns that silver’s 2026 high could mark a multi‑year peak. Volatility is extreme, the 60‑month MA ratio is stretched, and silver is behaving like a risk asset. Our own chart analysis shows price struggling to break above $85.
While industrial demand provides support, the risk‑reward favors caution. Silver may trade sideways or correct lower in the coming years.
FAQs

Yes for industrial demand, but the upside may be limited in the near term. Expect consolidation rather than a breakout to new highs.
It depends on your goal. Gold is a better store of value with lower volatility, while silver offers higher upside potential due to its industrial demand (solar, EVs, AI), but with much larger price swings.
Yes, it’s generally safe for daily wear, and some skin oils can even help slow tarnishing. However, exposure to water, sweat, and chemicals will accelerate tarnish, and in very rare cases, prolonged contact can cause skin discoloration (argyria).
Subscribe to our YouTube channel for daily crypto updates, market insights, and expert analysis.
The post Silver Price 2026 High Could Endure for Years, Bloomberg Analyst Warns appeared first on CaptainAltcoin.


추천 콘텐츠

Rheumatoid Arthritis Columbus: Personalized Treatment From Local Rheumatology Specialists
Australian Dollar Dips Below 0.7100 as Middle East Tensions Weigh on Risk Sentiment


