

Dogecoin (DOGE) Eyes Recovery as Bullish Signals Emerge After Consolidation
Key Takeaways
- Dogecoin appears to be forming its third accumulation pattern, with previous phases resulting in gains of 190% and 480% respectively
- Technical analyst Javon Marks identifies a bullish MACD divergence pattern with an initial price target set at $0.6533
- The meme coin maintains support above its 100-day EMA positioned at $0.1064, while facing resistance near the 200-day EMA at $0.1248
- Recent derivatives data shows $17 million in short position liquidations over four hours, indicating bearish traders are retreating
- Futures market activity reveals $1.64 billion in Open Interest with a 0.0057% positive funding rate, confirming continued buyer interest
The popular meme cryptocurrency Dogecoin is displaying preliminary indicators of a potential bullish reversal following its ability to maintain crucial moving average support levels and generate optimistic signals in futures market data. At the time of writing on Wednesday, DOGE maintains its position above the 100-day Exponential Moving Average (EMA) located at $0.1064, bouncing back following a two-day decline.
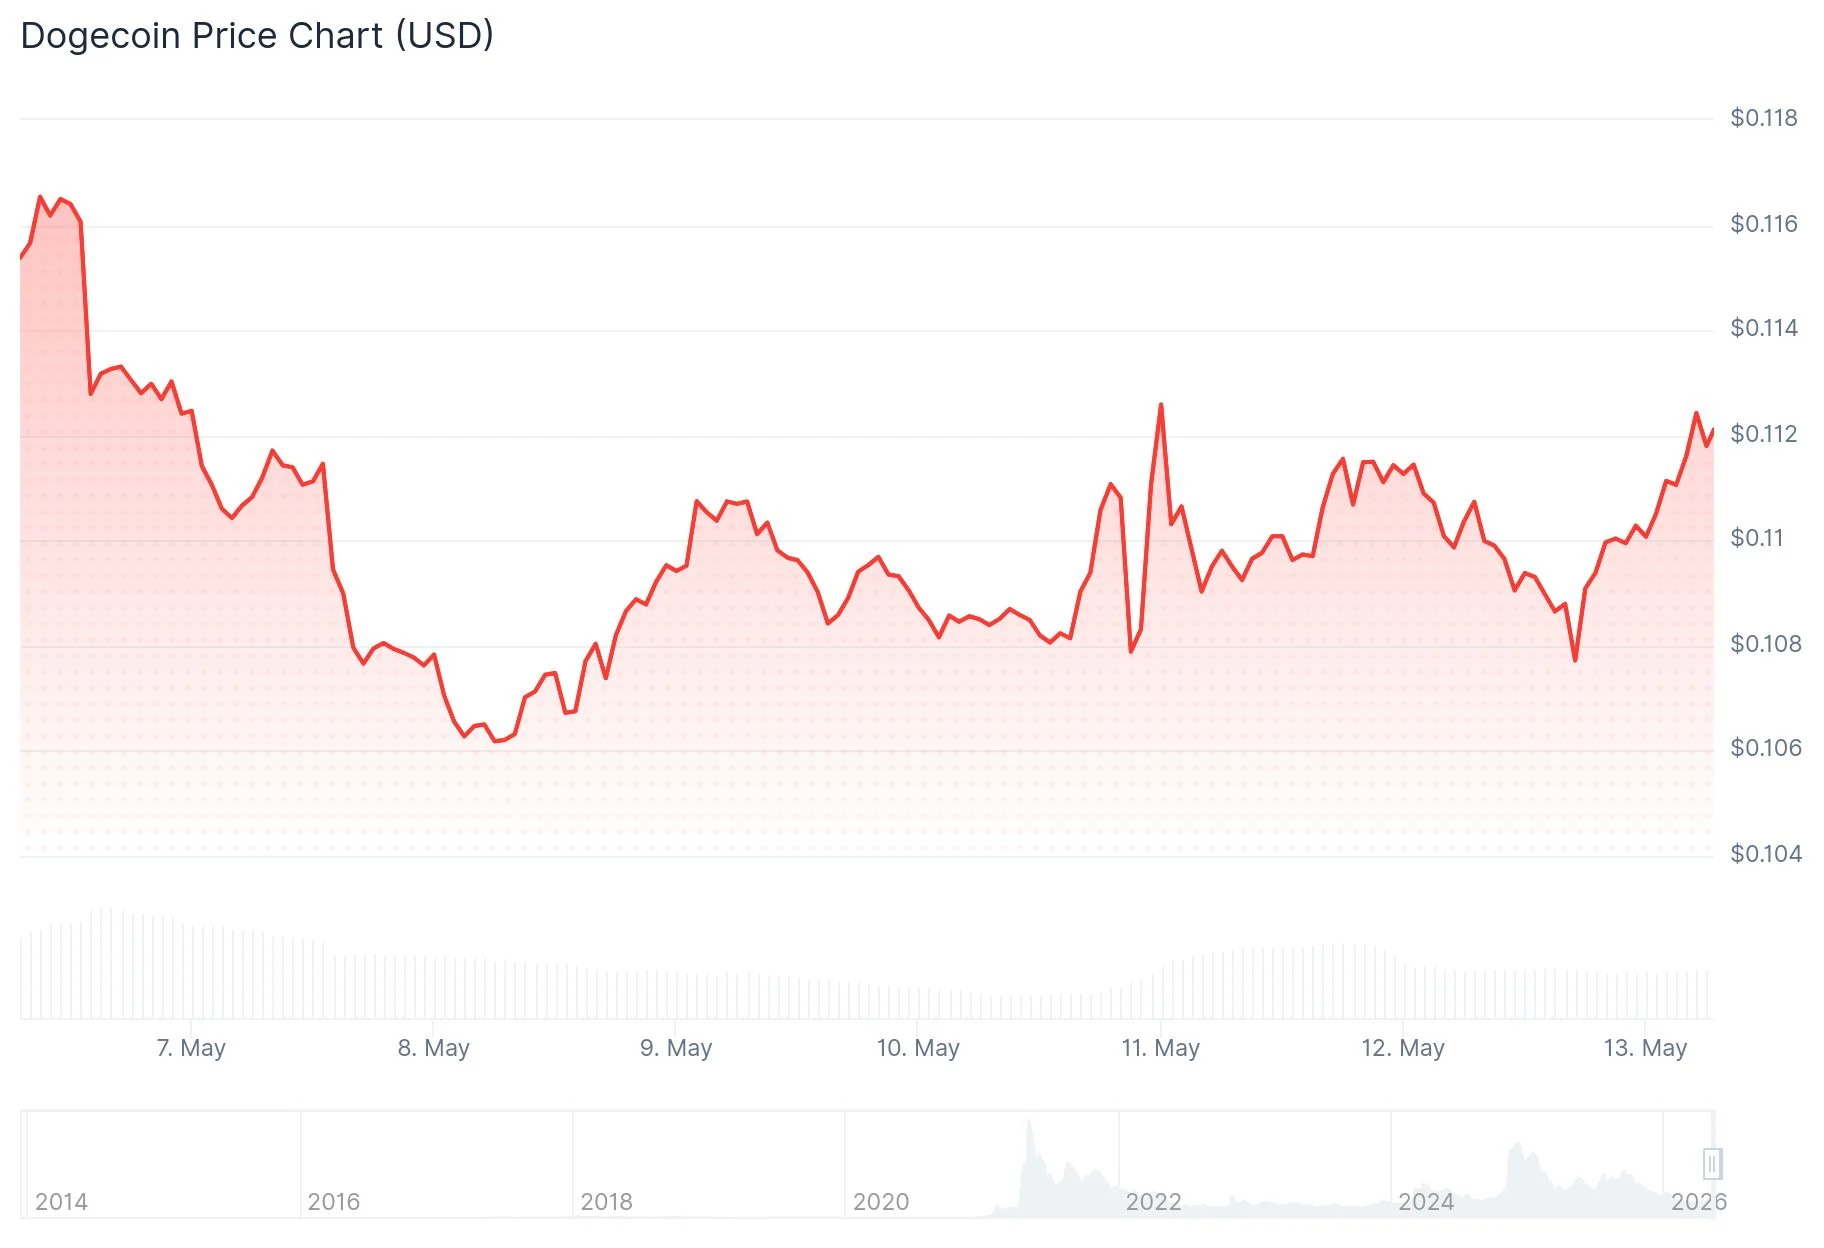 Dogecoin (DOGE) Price
Market analyst Javon Marks published a technical chart illustrating DOGE’s successful breach of an extended descending trendline that originated following the 2021 bull market peak. In Marks’ assessment, DOGE has begun exhibiting a response to a significant bullish divergence signal on the Moving Average Convergence Divergence (MACD) indicator. This divergence pattern emerges when price action creates lower lows while the momentum indicator starts showing improvement — a technical configuration that traders frequently interpret as a potential trend reversal signal.
According to Marks’ analysis, the initial significant upside objective sits at $0.6533, a price level that would represent a return to valuations last observed during the 2021 bull cycle. The analyst further suggested that a confirmed breakout above the $0.6533 threshold could potentially trigger an extended move toward $1.25, although such a scenario would require DOGE to demonstrate sustained strength above immediate resistance zones first.
Third Potential Accumulation Phase Emerges
Additional technical analysis from cryptocurrency analyst Bitcoinsensus presents a chart positioning DOGE within what they identify as “Accumulation 3?” — a horizontal consolidation pattern that mirrors two previous accumulation phases in Dogecoin’s price history. Historical data shows the first accumulation period preceded a substantial 190% upward movement, while the second accumulation phase led to an impressive 480% rally.
Bitcoinsensus emphasizes the importance of monitoring whether DOGE can successfully penetrate above the descending trendline that has constrained price action since the peak reached in late 2024. The Relative Strength Index (RSI) has begun rotating upward from oversold territory, with the RSI line crossing above its signal line — representing an early positive development, though technical observers note that stronger confirmation through sustained upward momentum remains necessary.
Derivatives Data Shows Short Squeeze Activity
Blockchain analytics and derivatives market information are contributing to the moderately optimistic outlook. According to CoinGlass tracking data, the past four hours witnessed $17 million of the total $21 million in liquidations originating from short positions. This concentration of short position liquidations typically emerges during brief recovery periods following extended oversold conditions.
 Source: Coinglass
DOGE futures Open Interest has experienced a modest recovery, climbing to $1.64 billion. The current funding rate stands at a positive 0.0057%, indicating that long position holders are willing to pay a premium to maintain their bullish bets — a characteristic signal of optimistic sentiment within the derivatives trading environment.
From a price structure perspective, immediate resistance emerges at the $0.1161 supply zone alongside the 200-day EMA positioned at $0.1248. A confirmed daily candle close above the $0.1248 threshold would be required to facilitate a potential advance toward the $0.1500 level. Downside support is established at the 100-day EMA ($0.1064) and the 50-day EMA ($0.1024).
The RSI indicator currently trades around 62, maintaining its position above the neutral 50 level, while the MACD has dipped slightly below the zero line, indicating that momentum signals remain somewhat conflicted following the recent upward movement.
The post Dogecoin (DOGE) Eyes Recovery as Bullish Signals Emerge After Consolidation appeared first on Blockonomi.


추천 콘텐츠

Web3 Financial Applications in America in 2026: Where Wallet-Native Finance Has Actually Found Users

Todd Blanche warned that lying is a crime during tense Senate grilling


