

Dogecoin (DOGE) Price: Is DOGE Setting Up for Another Mini Cycle Rally?
TLDR
- DOGE is trading inside a third accumulation zone, following two earlier phases that led to rallies of 190% and 480%
- A bullish MACD divergence has been spotted, with analyst Javon Marks pointing to a first target of $0.6533
- DOGE is currently holding above its 100-day EMA at $0.1064, with the 200-day EMA at $0.1248 acting as near-term resistance
- Short liquidations of $17 million in the last 4 hours suggest short sellers are pulling back, hinting at a short-term rebound
- DOGE futures Open Interest sits at $1.64 billion, with a positive funding rate of 0.0057% showing buyers are still active
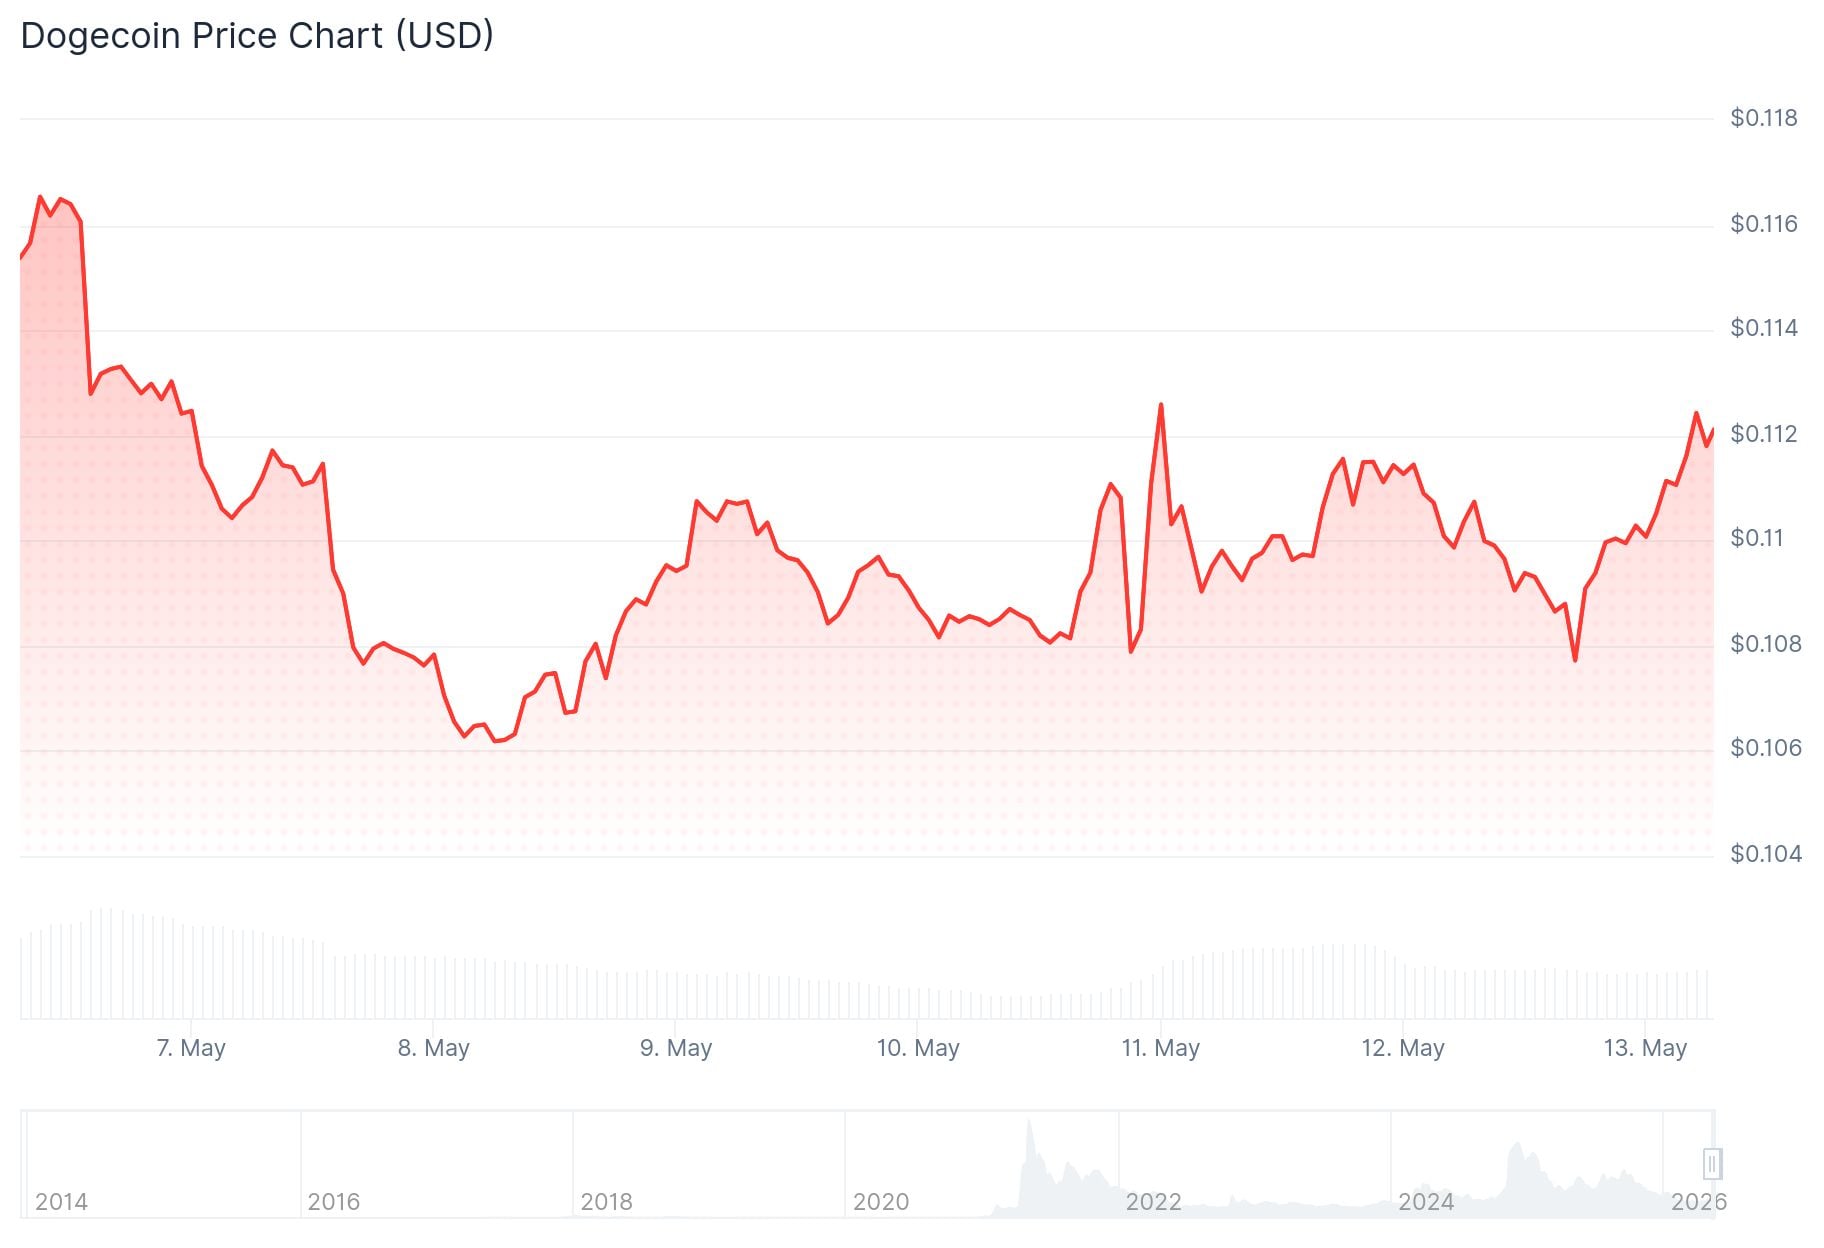
Dogecoin is showing early signs of a potential recovery after holding above key moving averages and flashing bullish signals in derivatives data. As of Wednesday, DOGE is trading above its 100-day Exponential Moving Average (EMA) at $0.1064, recovering after two days of losses.
 Dogecoin (DOGE) Price
Analyst Javon Marks shared a chart showing DOGE breaking away from a long descending trendline that began after the 2021 cycle high. According to Marks, DOGE has started to respond to a major bullish divergence on the MACD. A bullish divergence forms when price makes weaker lows while momentum begins to improve — a setup traders often watch as a sign of a possible trend reversal.
Marks set a first major upside target at $0.6533, a level that would bring DOGE back toward prices last seen in the 2021 cycle. He also noted that a break above $0.6533 could open the door toward $1.25, though DOGE would need to confirm strength above nearby resistance first.
Accumulation Zone in Focus
A separate chart shared by analyst Bitcoinsensus shows DOGE sitting in what they label “Accumulation 3?” — a sideways structure similar to two earlier phases in DOGE’s history. The first accumulation phase preceded a 190% move, and the second came before a 480% rally.
Bitcoinsensus is watching whether DOGE can break above a descending trendline that has been in place since the late 2024 high. The RSI has started turning higher from a low area, with the RSI line crossing back above its signal line — an early improvement, though analysts say stronger follow-through is still needed.
Short Liquidations Signal Possible Rebound
On-chain and derivatives data are adding to the cautiously positive picture. CoinGlass data shows that over the last 4 hours, $17 million of the $21 million in total liquidations came from short positions. This kind of short liquidation activity often appears during short-term recoveries after periods of overselling.
 Source: Coinglass
DOGE futures Open Interest has recovered slightly to $1.64 billion. The funding rate sits at a positive 0.0057%, which shows that buyers are paying a premium to hold long positions — a sign of bullish sentiment in the derivatives market.
On the price chart, initial resistance is at the $0.1161 supply zone and the 200-day EMA at $0.1248. A daily close above $0.1248 would be needed to push toward the $0.1500 level. Support sits at the 100-day EMA ($0.1064) and the 50-day EMA ($0.1024).
The RSI is hovering around 62, above the midline, while the MACD has slipped marginally below zero, suggesting momentum is still mixed following the recent advance.
The post Dogecoin (DOGE) Price: Is DOGE Setting Up for Another Mini Cycle Rally? appeared first on CoinCentral.


추천 콘텐츠

Web3 Financial Applications in America in 2026: Where Wallet-Native Finance Has Actually Found Users

Todd Blanche warned that lying is a crime during tense Senate grilling


