Solana price climbs toward overbought zone, can buyers push past $100?
Solana price continued pushing higher this week as bullish momentum strengthened near a major resistance zone that traders have closely watched since March.
- Solana price climbed above $96 after breaking key resistance near $90.63, with traders now watching a potential move toward $100.
- Optimism surrounding potential U.S. spot Solana ETF products and recovering network activity helped improve sentiment around the SOL ecosystem.
- Technical indicators, including the Aroon Up signal above 85%, suggested buyers remained firmly in control of the short-term trend.
According to data from crypto.news, Solana (SOL) traded around $94 at press time on May 13 after briefly climbing above $96 earlier in the session. The token has now recovered sharply from its April lows near $80, supported by improving sentiment around the Solana ecosystem.
Solana’s recent rally appears to have been driven by a combination of institutional inflows into newly launched U.S. spot Solana ETFs and growing optimism surrounding the network’s upcoming Alpenglow upgrade. Investor sentiment also improved after recent Firedancer-related developments reinforced Solana’s long-term scalability narrative.
At the same time, activity across the Solana ecosystem has started recovering, with decentralized exchange volumes and memecoin trading showing signs of renewed strength in recent weeks. Derivatives sentiment has also strengthened sharply, with SOL futures open interest climbing alongside positive funding rates, signaling growing bullish positioning among traders.
On the daily chart, Solana recently broke above the important resistance cluster near $90.63 before rallying toward the $96–$100 region, where sellers have started becoming more active.
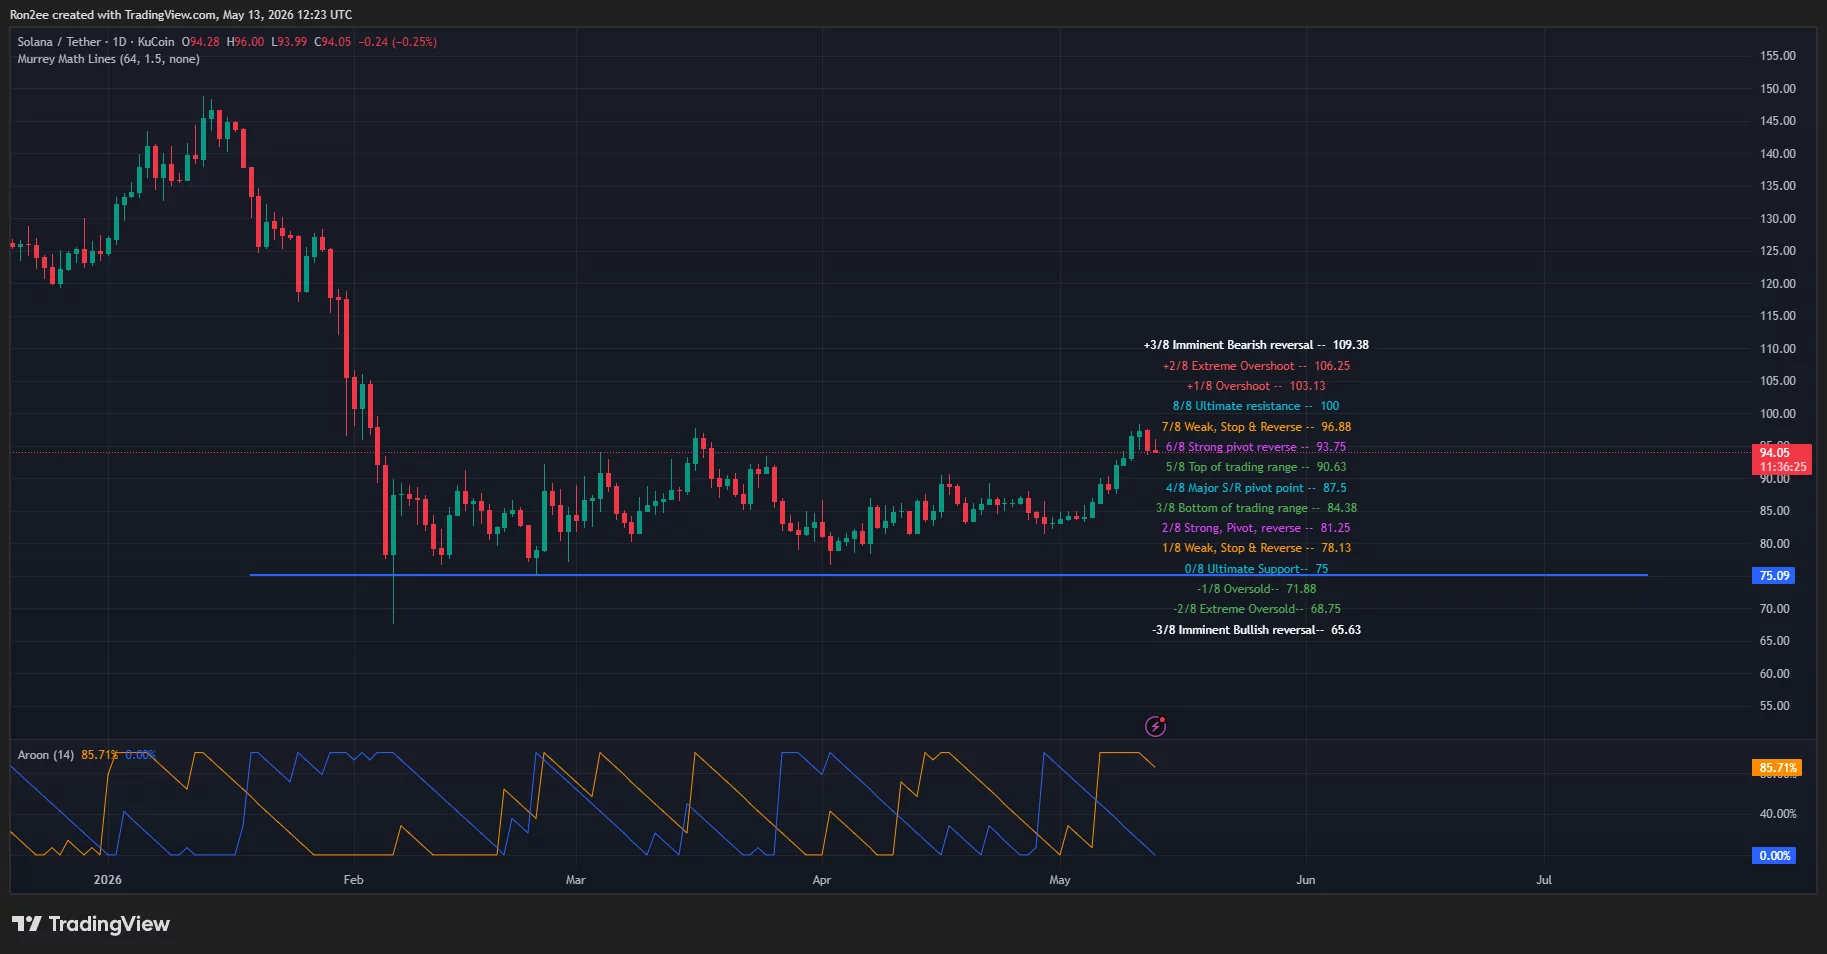
However, the broader structure still appears constructive as SOL continues trading above the strong pivot reversal zone near $93.75 while remaining well above the key long-term support area around $75, where buyers previously stepped in aggressively during earlier corrections.
A look at the Aroon indicator also reinforces the bullish outlook. Notably, the Aroon Up indicator currently stands above 85% while the Aroon Down remains near 0%, signaling that bullish momentum continues dominating the short-term trend.
Meanwhile, Solana is now approaching the 7/8 Murrey Math resistance level near $96.88, which is often considered a weak resistance and potential reversal zone. A successful breakout above that level could strengthen bullish momentum and potentially open the door for a move toward the psychological $100 mark, followed by the $103 and $106 resistance zones.
Still, momentum appears to be gradually approaching overbought territory after SOL’s sharp rebound over the past several weeks. Failure to hold above the $93–$94 region could weaken the bullish structure and potentially trigger a temporary pullback toward the $90 support zone before another breakout attempt emerges.
For now, traders remain focused on whether Solana can establish a decisive move above $100, which could significantly strengthen the broader bullish structure heading into the second half of May.
Disclosure: This article does not represent investment advice. The content and materials featured on this page are for educational purposes only.


추천 콘텐츠

The Chemistry of UV Resistance: How Titanium Dioxide Protects Against the California Sun

Top Line plans Cebu energy complex to boost storage capacity