Oracle Stock Holds Above 200-Day EMA as AI Target Hikes Support Shares

Oracle Stock (ORCL) is pausing after a strong multi-session run, with the daily bias tentatively bullish. Tuesday’s close at 186.83 held just above the 200-day EMA, preserving the broader uptrend as intraday momentum cools amid supportive AI headlines and recent target hikes.
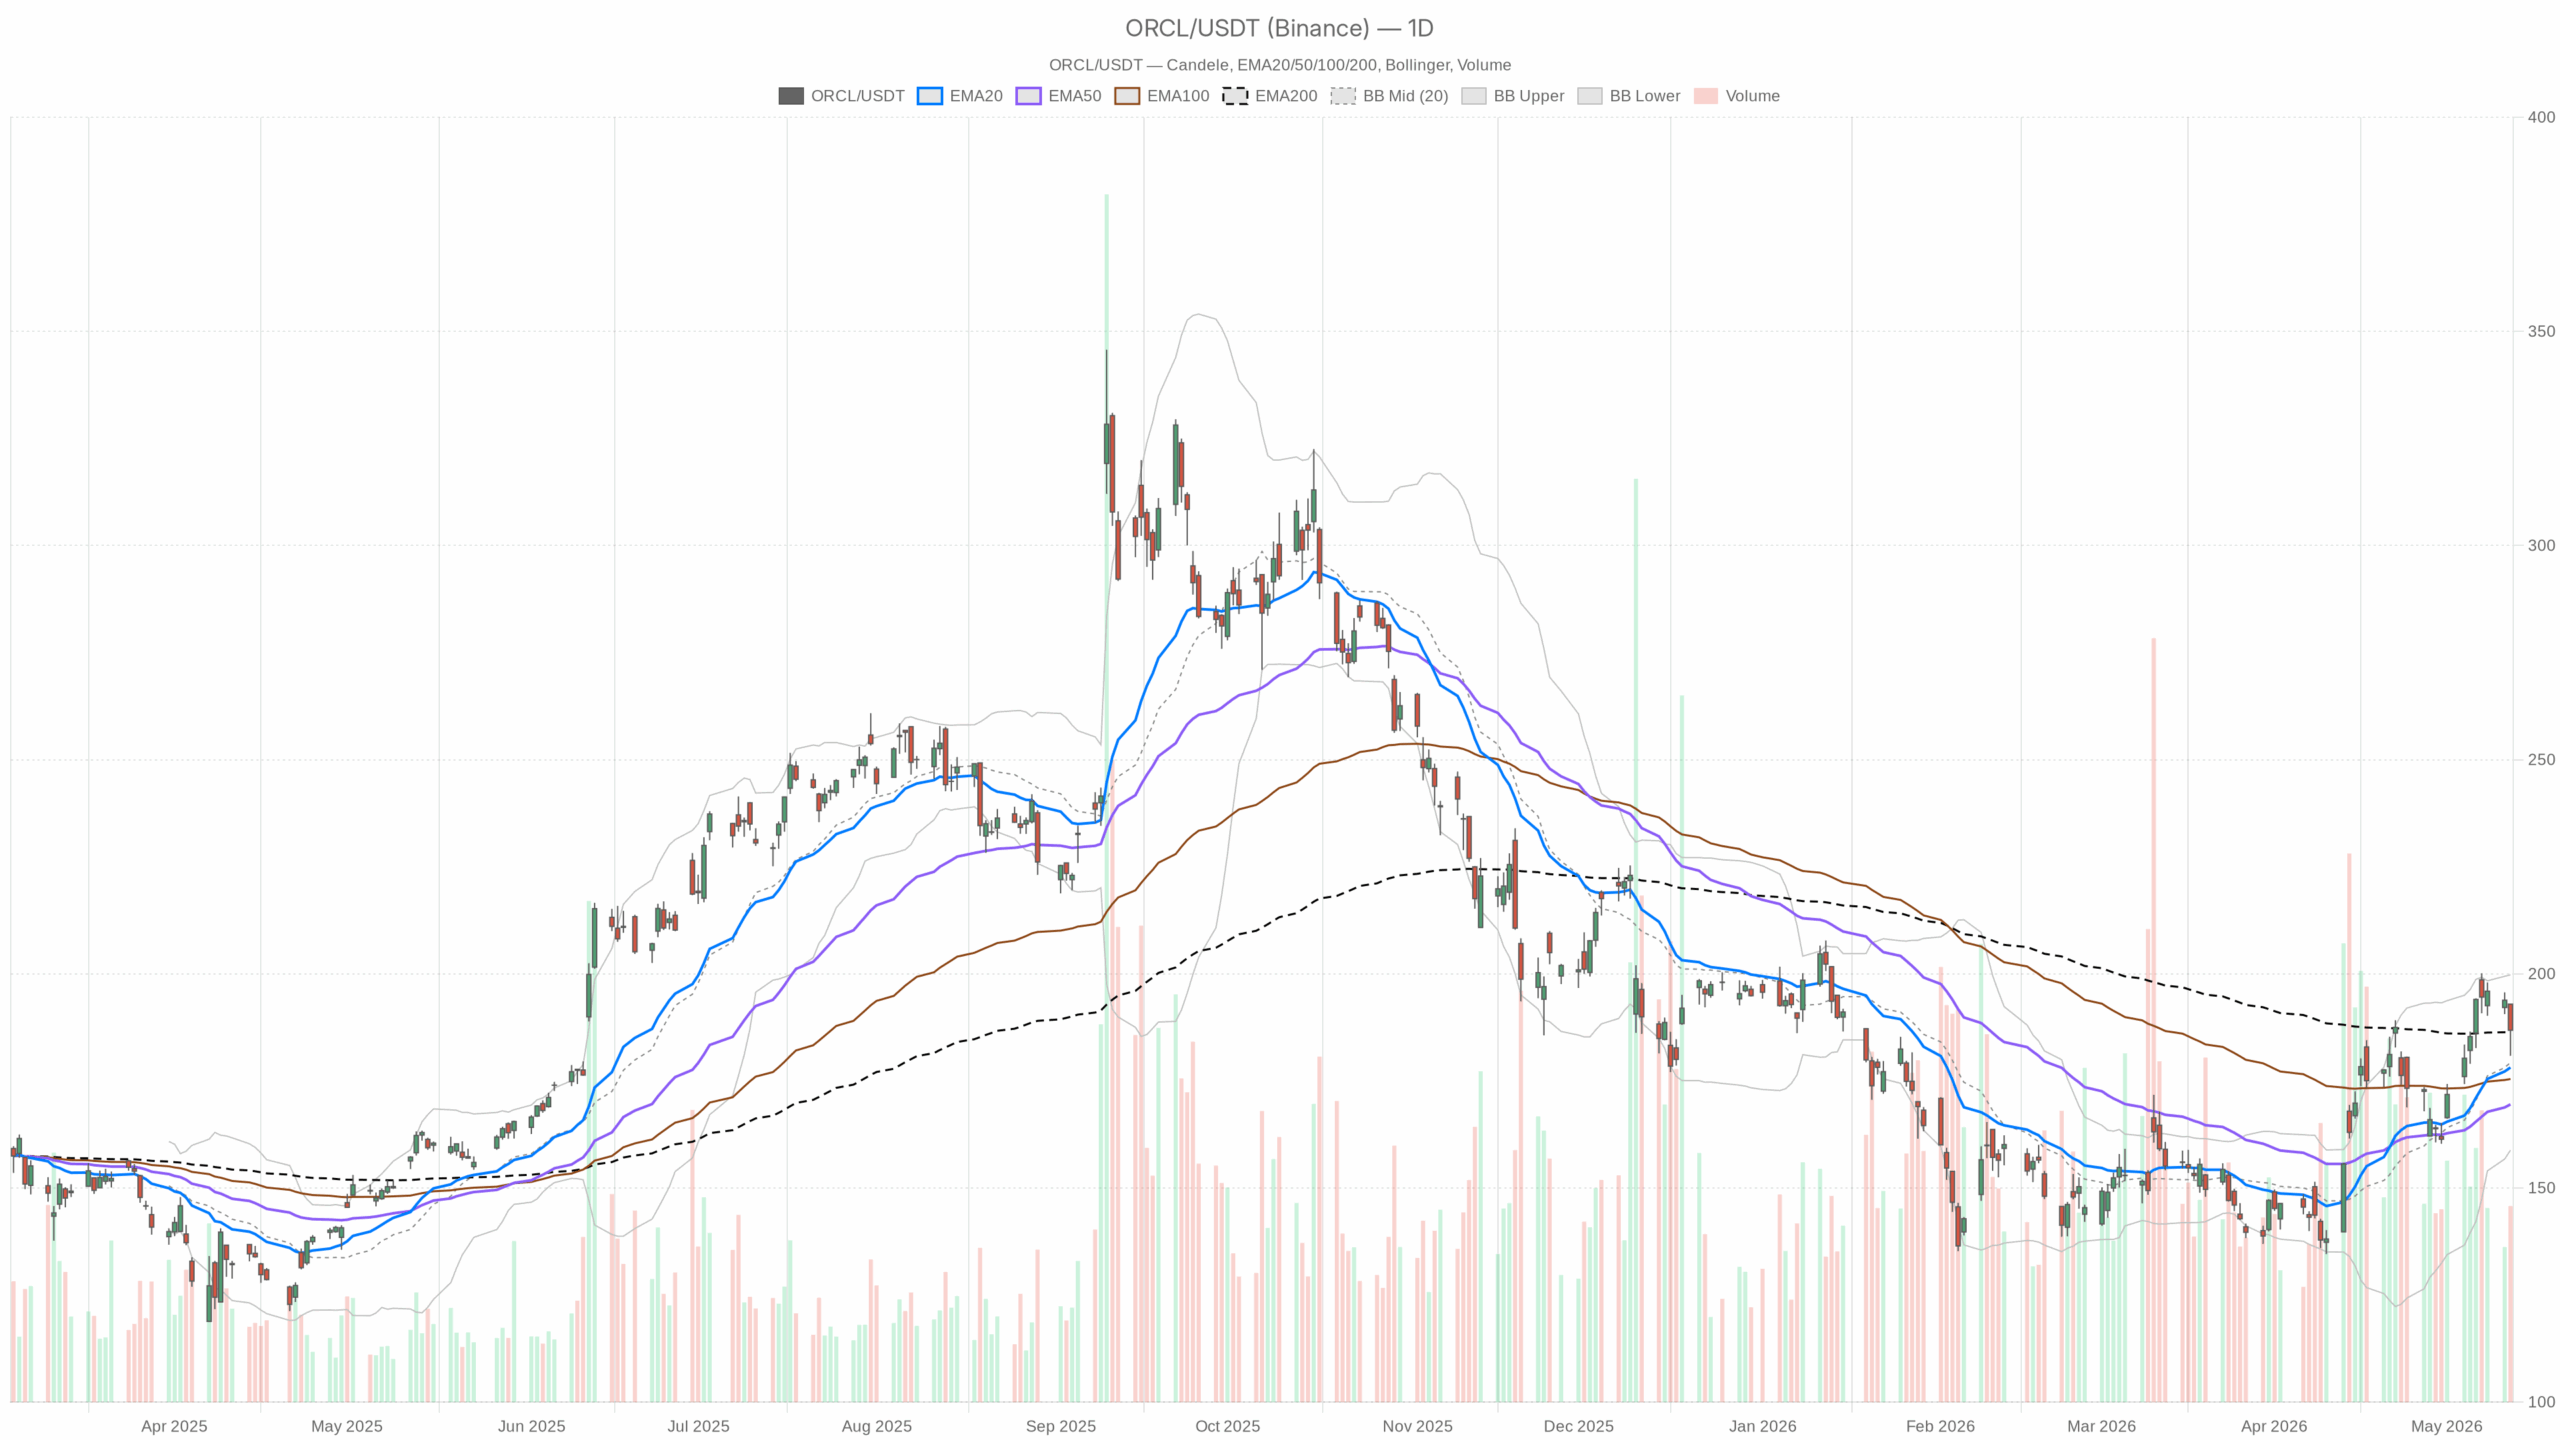 ORCL — daily chart with candlesticks, EMA20/EMA50 and volume.
Daily technical outlook for Oracle Stock
Trend and momentum
Meanwhile, the daily chart still leans upward. EMA20 sits at 178.13, EMA50 at 169.52, and EMA200 at 186.37. Price closed at 186.83, above the 20/50-day and marginally above the 200-day. That keeps the primary uptrend intact, though the grip is thin. RSI14 at 60.02 signals positive momentum without stretch. MACD line at 8.91 with a 1.29 histogram shows bulls retain the initiative, while acceleration is modest.
Volatility and levels
Notably, Bollinger Bands sit with a mid at 179.29, an upper at 199.77, and a lower at 158.82. Price is in the upper half, leaving room toward 200 without looking overextended. ATR14 at 9.37 keeps daily volatility elevated, so position sizing risk is non-trivial. The daily pivot is 186.87, with R1 at 192.88 and S1 at 180.83. Tuesday’s close near the pivot marks a balance point; 192–193 is first resistance, while 181 is first support.
Hourly chart: consolidation within a larger uptrend
Structure and pivots
However, the 1-hour picture softens the immediate tone. EMA20 at 189.02 and EMA50 at 187.14 sit above price, while EMA200 at 173.71 is far below. This frames an intraday pullback within a larger uptrend. RSI14 at 44.1 is mildly bearish. MACD at -1.5 with a negative histogram shows sellers control the short-term tape.
In turn, the Bollinger mid at 191.23 sits above price, so mean reversion favors resistance overhead. ATR14 at 2.88 implies wide hourly swings that can whipsaw late entries. The hourly pivot is 186.28, with R1 at 187.51 and S1 at 185.55. Price hovering around the pivot underscores indecision; 187.5 is a nearby intraday hurdle.
15-minute execution context: rebound meets resistance
At the same time, the 15‑minute context shows a rebound pressing resistance. EMA20 at 185.43 and EMA200 at 186.41 are beneath price, but EMA50 at 187.86 caps from above. That places overhead supply near 188. RSI14 at 54.61 is constructive, and the MACD histogram is positive, keeping buyers in the near-term lead.
Notably, the Bollinger upper band at 186.73 has been marginally exceeded. This slight overextension invites a pause or minor pullback. ATR14 at 0.98 suggests roughly $1 intraday wiggles around key levels. The intraday pivot is 186.47 with R1 at 187.32. Holding above 186.5 favors a push toward 187.3–188, but follow-through needs fresh demand.
Scenarios for Oracle Stock
Base case
Therefore, the base case stays cautiously bullish on the daily timeframe. Meanwhile, the hourly chart flags consolidation or dip‑buying rather than a clean breakout. A firm hold above the 200-day EMA at 186.37 is the first step. A push through 187.5 (H1 R1) and then 192.88 (D1 R1) would bolster odds of a run toward the daily upper band near 200. Higher lows above 186–187 would confirm buyers are back in control.
Bearish risk
On the other hand, the bearish scenario emerges if Oracle Stock loses the 200-day EMA and the daily pivot on a closing basis. A break below 186.37 and 186.87 would likely expose 185.55 (H1 S1) first and then 180.83 (D1 S1). Failure to defend 186 would turn the recent pullback into a deeper retracement, complicating the medium‑term uptrend.
Overall, positioning into midweek looks two‑way but skewed to the upside while 186 holds. Volatility is elevated across timeframes, so execution should respect the 187–193 resistance band and the 181 support shelf. Uncertainty hinges on whether intraday sellers fade near 187–188 or cede ground for a retest of 192–193.
Fundamental and sentiment drivers
Notably, near‑term sentiment has a tailwind. Oppenheimer lifted its Oracle price target to 235 on AI demand, and Arete upgraded to Buy with a 255 target. Such sell‑side conviction can cushion dips during consolidation for Oracle Stock.
Additionally, Oracle’s integration with Eightfold AI and the addition of Cleveland Clinic’s CEO to the board support the longer‑term AI and healthcare‑data narrative. Fundamental news flow remains supportive even as price digests gains after a six‑session rally.


추천 콘텐츠

Crypto mining stocks suffer brutal quarterly slump

Southwestern National Bank Introduces New Brand and Trade Name