Bitcoin Price Dips Further Below $80K—Bears Tighten Grip On Market
Bitcoin price started a fresh decline below the $80,500 zone. BTC is consolidating and might struggle to stay above the $78,800 support.
- Bitcoin failed to stay above $80,500 and extended losses.
- The price is trading below $80,000 and the 100 hourly simple moving average.
- There is a bearish trend line forming with resistance at $80,700 on the hourly chart of the BTC/USD pair (data feed from Kraken).
- The pair might extend losses if it stays below the $80,500 and $81,200 levels.
Bitcoin Price Dips Further
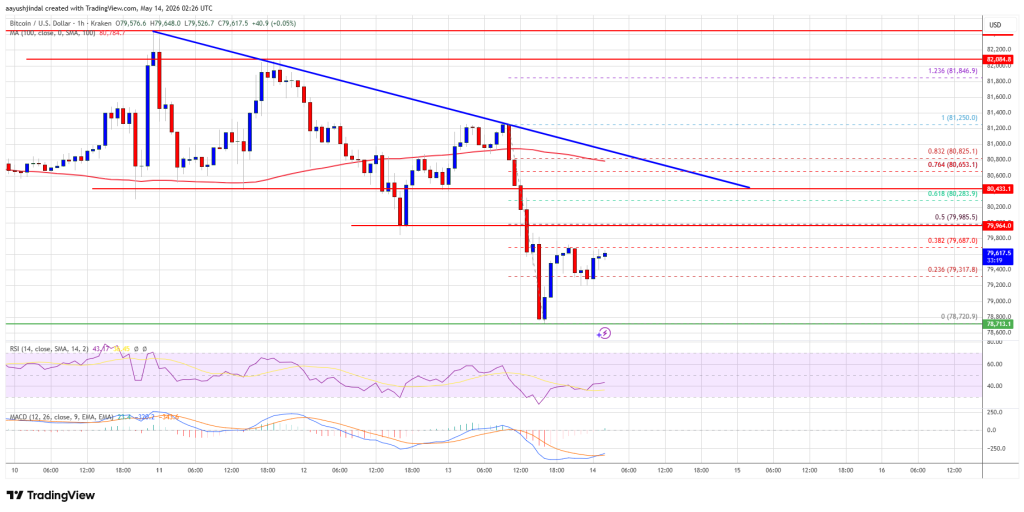
Bitcoin price failed to stay above the $80,500 support zone. BTC remained in a bearish zone and extended losses below the $80,000 level. There was a move below the $79,500 level.
The price even dipped below $79,000. A low was formed at $78,720 and the price is now consolidating losses. There was a minor increase above the 23.6% Fib retracement level of the downward move from the $81,250 swing high to the $78,720 low.
Bitcoin is now trading below $80,500 and the 100 hourly simple moving average. If the price remains stable above $79,000, it could attempt a fresh increase. Immediate resistance is near the $80,000 level or the 50% Fib retracement level of the downward move from the $81,250 swing high to the $78,720 low.
The first key resistance is near the $80,500 level. There is also a bearish trend line forming with resistance at $80,700 on the hourly chart of the BTC/USD pair.
A close above the $80,700 resistance might send the price further higher. In the stated case, the price could rise and test the $81,200 resistance. Any more gains might send the price toward the $82,000 level. The next barrier for the bulls could be $82,500.
Downside Extension In BTC?
If Bitcoin fails to rise above the $80,500 resistance zone, it could start another decline. Immediate support is near the $79,200 level.
The first major support is near the $78,800 level. The next support is now near the $78,000 zone. Any more losses might send the price toward the $76,200 support in the near term. The main support now sits at $75,500, below which BTC might struggle to recover in the near term.
Technical indicators:
Hourly MACD – The MACD is now losing pace in the bearish zone.
Hourly RSI (Relative Strength Index) – The RSI for BTC/USD is now below the 50 level.
Major Support Levels – $79,200, followed by $78,800.
Major Resistance Levels – $80,000 and $80,700.


추천 콘텐츠

UAE hookah company seesaws on Nasdaq launch

FootballersCV Launches Professional Football CV Platform Connecting Players With Scouts, Agents, and Clubs Worldwide