Bitcoin (BTC) Price Loses Critical $80K Level as Crypto Markets Turn Bearish—What’s Next?

The post Bitcoin (BTC) Price Loses Critical $80K Level as Crypto Markets Turn Bearish—What’s Next? appeared first on Coinpedia Fintech News
Bitcoin price plunged below the crucial $80,000 mark over the past few hours, triggering fresh uncertainty across the crypto markets. The sharp pullback came amid a combination of rising macroeconomic pressure, weakening market sentiment, and massive derivatives liquidations that accelerated the downside move. After facing repeated rejection near the $82,000 resistance zone, BTC lost key support levels as traders reacted to hotter-than-expected U.S. inflation data and increasing fears of prolonged tight monetary policy.
As the bearish momentum intensified, several market factors aligned simultaneously, fueling the latest correction in Bitcoin price.
Bitcoin Short-Term Holders Increased Selling Pressure
One of the major factors that contributed to Bitcoin’s drop below $80,000 was the rising selling activity from short-term holders (STHs). Recent data from CryptoQuant shows that STH loss pressure surged sharply as BTC failed to sustain momentum above the $82,000 resistance zone. As the Bitcoin price faced repeated rejection near local highs, many short-term holders reportedly began selling their holdings near breakeven levels, increasing the overall market supply.
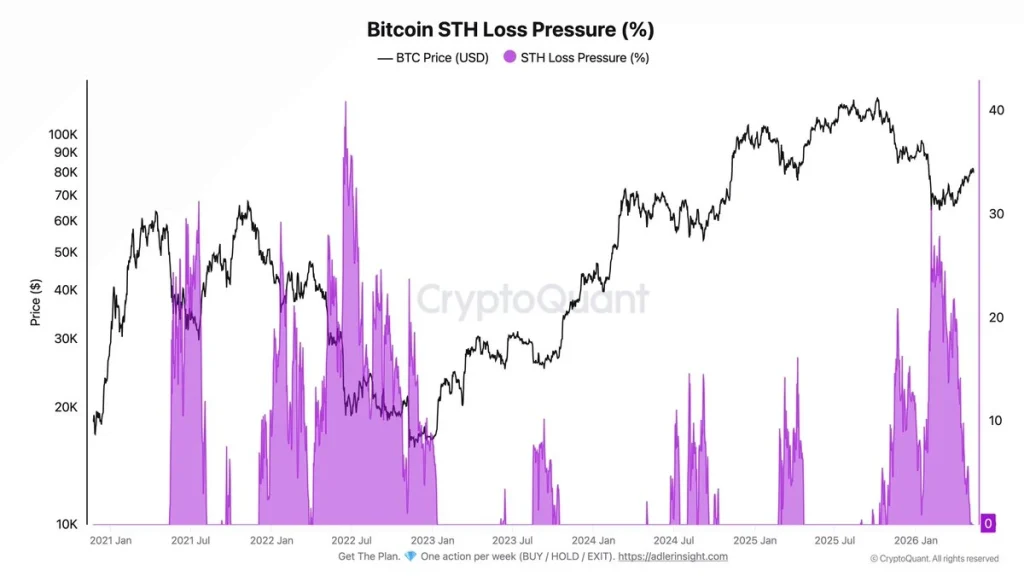
The latest spike in STH loss pressure suggests that weak hands were exiting positions amid growing uncertainty caused by macroeconomic concerns and declining bullish momentum. This additional selling pressure likely accelerated Bitcoin’s downside move below the crucial $80,000 support level. The current trend indicates that recent buyers are becoming increasingly cautious as volatility rises across the crypto market.
Bitcoin ETF Outflows Added More Downside Pressure
Another key reason behind Bitcoin’s latest correction was the sudden slowdown in spot Bitcoin ETF inflows, which weakened institutional buying momentum at a crucial resistance zone. Recent Glassnode data shows that U.S. spot Bitcoin ETFs recorded a noticeable rise in net outflows just as BTC struggled to maintain strength above $80,000.
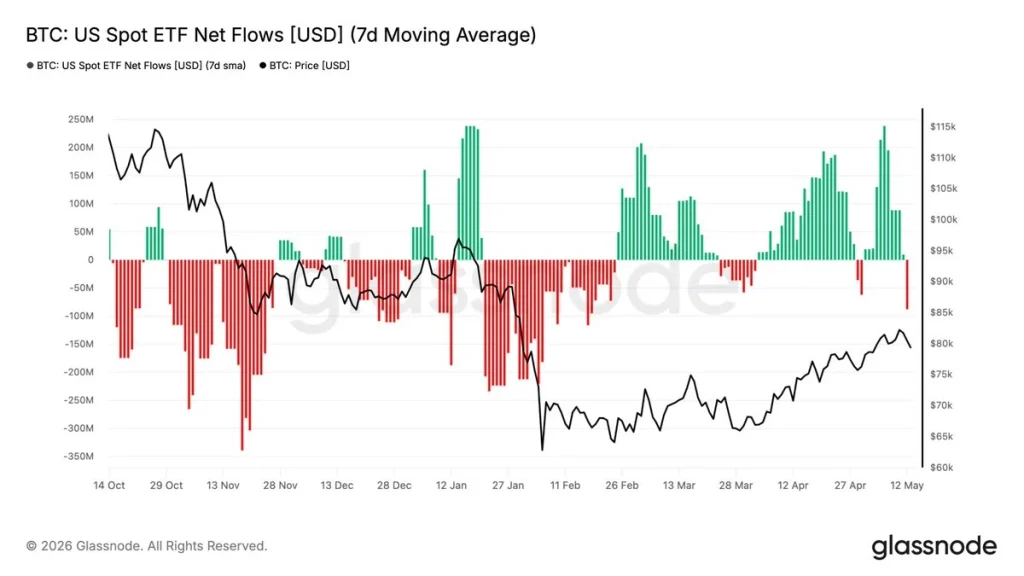
The chart highlights that ETF inflows remained one of the strongest drivers behind Bitcoin’s recovery rally over the past several weeks. However, the latest decline in net flows suggests that institutional demand started cooling as macroeconomic uncertainty increased and BTC faced repeated rejection near the $82,000 resistance zone.
Bitcoin Faces Another Rejection at the 200-Day Moving Average
Bitcoin’s latest decline below $80,000 came shortly after the price faced another rejection at the 200-day moving average (MA), a level that has historically acted as a major resistance zone during bearish phases. The latest rejection near $82,000 has raised concerns among traders, especially because BTC witnessed a massive correction the last time it failed to reclaim this indicator decisively. A similar rejection earlier in the cycle triggered a sharp 44% correction, pushing BTC from the local highs toward the $60,000 region.
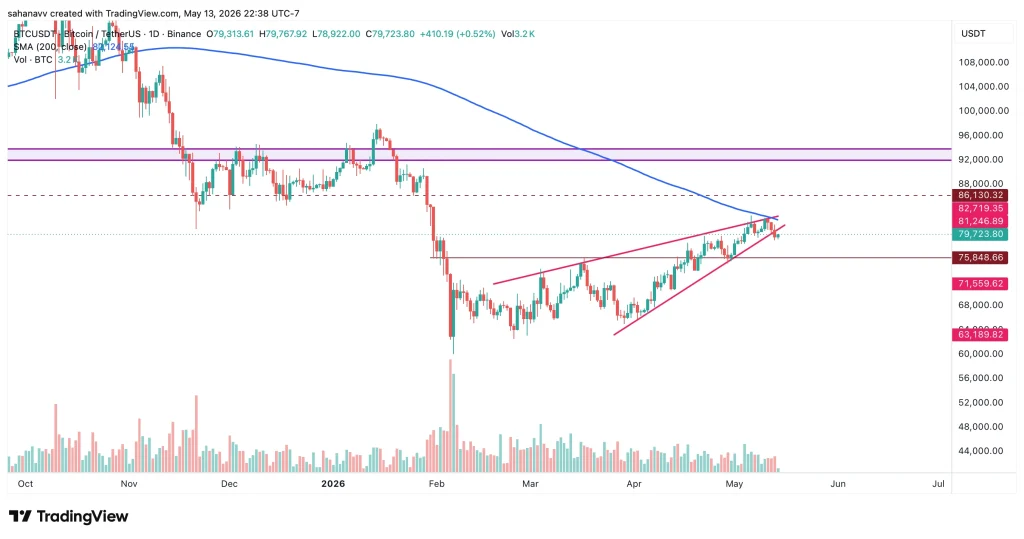
In the current setup, BTC also appears to have broken down from a rising wedge formation immediately after testing the 200-day moving average. This suggests that bullish momentum weakened significantly as sellers defended the resistance zone aggressively. The repeated inability to reclaim the 200-day MA could signal that the market is still lacking strong spot demand despite recent recovery attempts. If Bitcoin fails to regain this level quickly, traders may begin anticipating a broader corrective phase similar to the previous rejection that resulted in a 44% decline.
Bitcoin Price Prediction: Can BTC Hold $75K or Is a Bigger Correction Ahead?
Bitcoin’s rejection at the 200-day moving average has shifted short-term momentum back in favor of the bears. Besides, the ETF inflows weaken, short-term holders increase selling pressure, and macroeconomic uncertainty intensifies. The failure to reclaim the $82,000–$83,000 resistance zone now places the BTC price at a critical technical crossroads.
If Bitcoin continues trading below the 200-day MA, the next major support remains around $75,800, which previously acted as a strong breakout zone. Losing this level could expose BTC to a deeper correction toward $71,500, while an extended sell-off may even drag the price toward the $63,000 region — a level that aligns with the previous consolidation base.
On the bullish side, Bitcoin needs to reclaim and hold above $82,000 to invalidate the current bearish structure. A strong recovery above this resistance could revive bullish momentum and open the doors for a rally toward the $86,000 zone. As long as Bitcoin stays below the 200-day moving average, volatility and downside risks are likely to remain elevated in the near term.


추천 콘텐츠

HYPE Within $11 of ATH as SpaceX Perps Drive Rally

BNB slips below $590 as Trump threatens to strike Iranian power plants